MACROECONOMY & END-USE INDUSTRIES
Running tab of macro indicators: 13 out of 20

The number of new jobless claims fell by 16,000 to 207,000 during the week ending January 25. Continuing claims fell by 42,000 to 1.858 million, and the insured unemployment rate for the week ending January 18 was unchanged at 1.2%.
Consumer spending rose 0.7% in December, finishing out the year on a strong note. Disposable personal income rose 0.4%. Compared to a year ago, real consumer spending was up 3.1%, while disposable personal income was up by 2.4%. The personal savings rate eased to 3.8%, the lowest in two years. The price index for personal consumption expenditures (PCE) moved higher at the headline level (to 2.6% Y/Y), but the core PCE price index was stable at 2.8% for a third month. This remains above the Fed’s 2% target.
The FOMC left interest rates unchanged at its first meeting of 2025 and signaled that it would pause rate cuts and carefully review incoming data. In its statement the Fed said “Recent indicators suggest that economic activity has continued to expand at a solid pace. The unemployment rate has stabilized at a low level in recent months, and labor market conditions remain solid. Inflation remains somewhat elevated.”
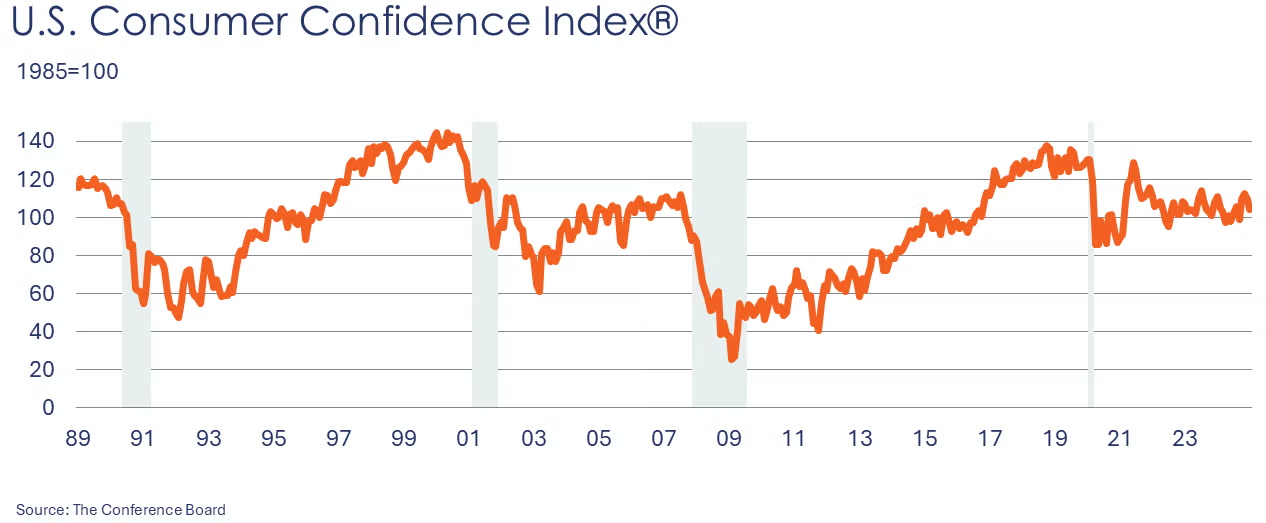
Consumer confidence slipped for a second month at the beginning of the new year, off 5.4 points in January to 104.1. Consumers’ assessment of current business and labor market conditions fell sharply. Consumers’ expectations also deteriorated slightly. Both inflation and interest rate expectations were higher. More consumers planned to buy big-ticket items over the next six months than not, but the share was down slightly. Consumer buying plans were flat for most appliances and still down for electronics on a six-month moving average basis.
New home sales finished the year on a high note, up by 3.6% in December. Sales were higher in the Northeast and West, but lower in the South and Midwest. Inventories of homes available for sale at the end of the month were up by 1.2%, representing an 8.5-month supply. Compared to a year ago, sales were up 6.7% while inventories were 10.0% higher. The median sales price was up 2.1% Y/Y to $427,000.
New orders for durable goods fell for a second month in December, off by 2.2%. The decline was led by sharply lower orders for civilian aircraft, however. Orders were also lower for defense equipment, motor vehicles, computers, communications equipment, and primary metals. Those declines were partially offset by higher orders for fabricated metal products, machinery, electronics (excluding computers and communications equipment), and electrical equipment. Core business orders continued to expand at the end of the year, up by 0.5%. Compared to a year ago, headline orders were 3.8% lower while core business goods were up by 3.0%.
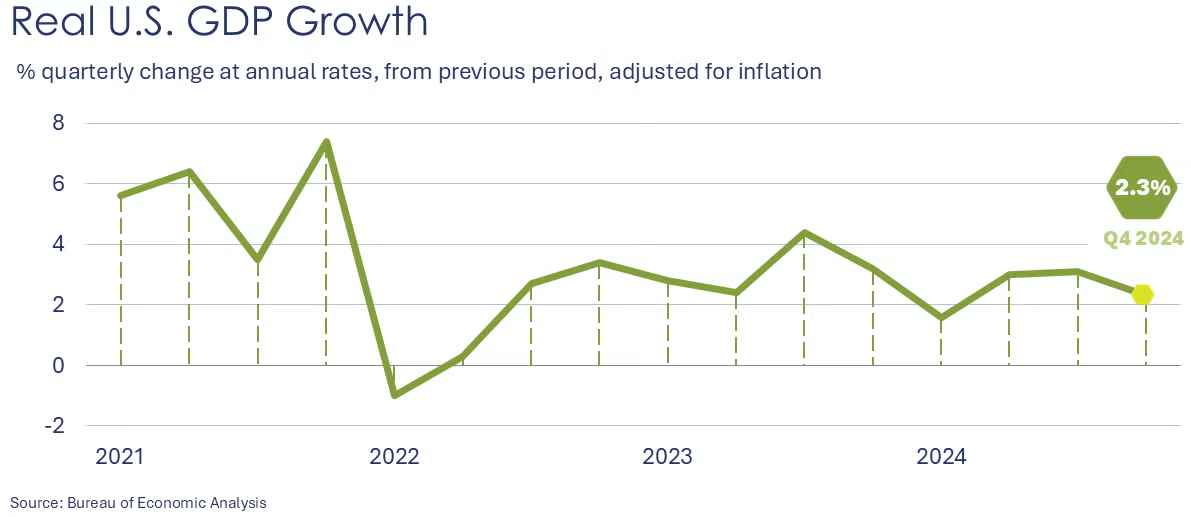
US GDP grew by a 2.3% seasonally adjusted annual rate (SAAR) in Q4 according to the first of three estimates provided by the Bureau of Economic Analysis. Consumer spending powered much of the gain with the strongest gain in goods consumption in nearly two years. There were smaller contributions from residential investment, intellectual property investment, government spending, and lower imports. These gains were offset by negative contributions from nonresidential investment in equipment and structures, private inventories, and exports. Compared to Q4 2023, GDP was 2.5% higher. Growth in prices ticked up in Q4 with several headline and core measures coming in slightly higher than in Q3.
Texas manufacturing activity picked up in January and the outlook improved. The general business activity index of the Dallas Fed’s Texas Manufacturing Outlook Survey rose 9.6 points to 14.1 during the first month of the year. Production, capacity utilization, new orders, shipments, and employment expanded. Looking ahead over the next six months, the outlook improved across a number of indicators.
The Richmond Fed manufacturing survey (which covers DC, MD, NC, SC, VA, and most of WV), indicated soft activity and most markers remained contractionary. Shipments, new orders, backlog, and capacity utilization all declined. Apart from capex, manufacturers’ expectations for the coming six months remain solidly optimistic, however.
ENERGY

- Oil prices eased from a week ago following a large inventory build in US commercial stocks.
- U.S. natural gas prices also settled as milder weather is on the horizon.
- With last week’s cold snap, natural gas inventories fell by 321 BCF, the fourth-largest inventory draw on record.
- The combined oil & gas rig count fell for a third consecutive week, down by another 5 to 571, its lowest level in more than three years.
CHEMICALS
Indicators for the business of chemistry suggest a yellow banner.

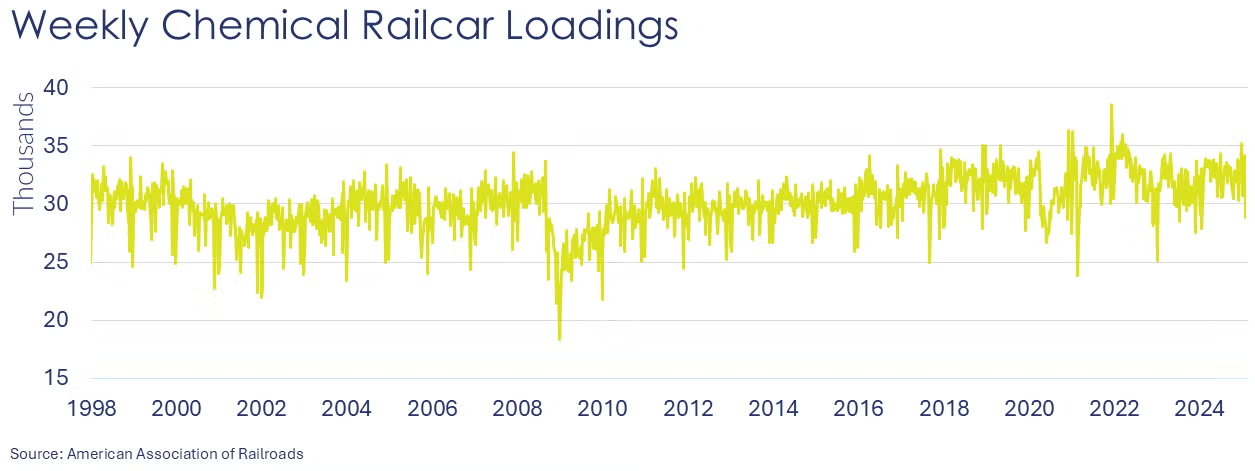
According to data released by the Association of American Railroads, chemical railcar loadings were down to 28,789 for the week ending January 25. Loadings were up 3.8% Y/Y (13-week MA), up (5.0%) YTD/YTD and have been on the rise for 6 of the last 13 weeks.
Note On the Color Codes
Banner colors reflect an assessment of the current conditions in the overall economy and the business chemistry of chemistry. For the overall economy we keep a running tab of 20 indicators. The banner color for the macroeconomic section is determined as follows:
Green – 13 or more positives
Yellow – between 8 and 12 positives
Red – 7 or fewer positives
There are fewer indicators available for the chemical industry. Our assessment on banner color largely relies upon how chemical industry production has changed over the most recent three months.
For More Information
ACC members can access additional data, economic analyses, presentations, outlooks, and weekly economic updates through ACCexchange: https://accexchange.sharepoint.com/Economics/SitePages/Home.aspx
In addition to this weekly report, ACC offers numerous other economic data that cover worldwide production, trade, shipments, inventories, price indices, energy, employment, investment, R&D, EH&S, financial performance measures, macroeconomic data, plus much more. To order, visit http://store.americanchemistry.com/.
Every effort has been made in the preparation of this weekly report to provide the best available information and analysis. However, neither the American Chemistry Council, nor any of its employees, agents or other assigns makes any warranty, expressed or implied, or assumes any liability or responsibility for any use, or the results of such use, of any information or data disclosed in this material.
Contact us at ACC_EconomicsDepartment@americanchemistry.com.

