Running tab of macro indicators: 9 out of 20
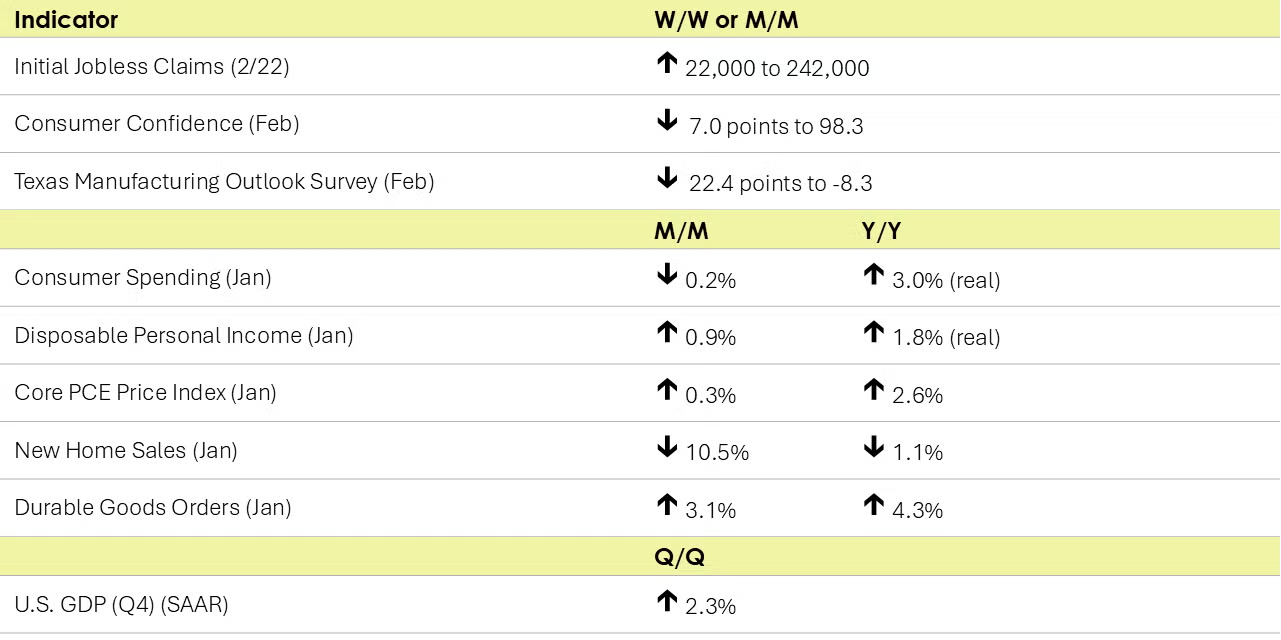
The number of new jobless claims rose by 22,000 to 242,000 during the week ending February 22. Continuing claims fell by 5,000 to 1.82 million, and the insured unemployment rate for the week ending February 15 was unchanged at 1.2%.
Consumers pulled back spending in January (by 0.2%). It was a super cold month in many parts and that may be at least partially to blame. Personal income rose 0.9% in January as did disposable personal income (personal income less taxes). Following a draw-down to 3.5% in December, the personal saving rate—personal saving as a percentage of disposable personal income—was 4.6% (the highest rate observed since June 2024) in January. Real consumer spending was up 3.0% Y/Y, while disposable personal income was up by 1.8% Y/Y. The Fed’s preferred measure of inflation - the core PCE price index – moderated to a 2.6% Y/Y pace, the slowest it’s been since last June. The core PCE price index excludes energy and foods prices. While the Y/Y comparison for energy prices shot up in January, food price inflation moderated.
Consumer confidence took a hit this month. The Conference Board’s Consumer Confidence Index fell 7.0 points to 98.3 in February, as consumers’ assessment of both the current and future situation deteriorated. While consumers felt business conditions are little better, they were less positive about the labor market. Looking ahead six months, consumers expect business conditions, the labor market, and income prospects to worsen. Consumers are feeling worse about their family’s financial situation currently and over the short-term and well over half of consumers think a US recession over the next 12 months is “somewhat” or “very” likely.
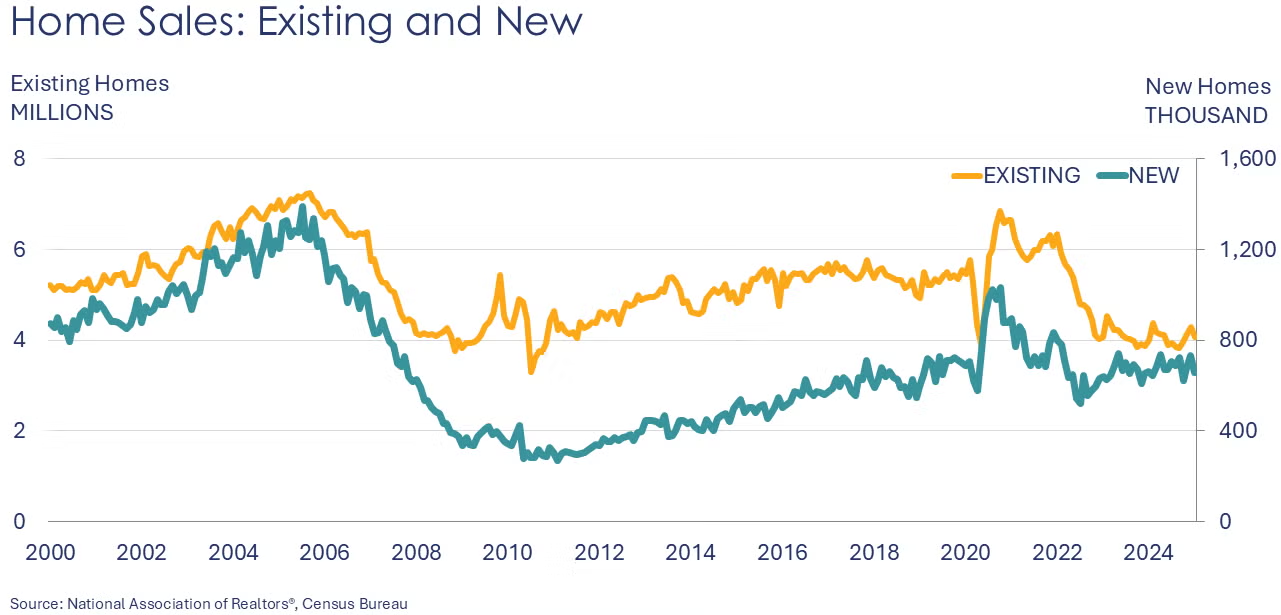
After a strong finish last year, new home sales fell 10.5% in January to a seasonally adjusted annual rate of 657,000. Sales were lower in all regions except the West. Inventories of homes available for sale at the end of the month were up by 1.4%, representing a 9.0-month supply. Compared to a year ago, sales were down 1.1% while inventories were 7.4% higher. At $446,300 in January, the median sales price was well above last year’s average of $419,700.
New orders for durable goods rose 3.1% in January, reflecting a near doubling in the value of new nondefense aircraft orders. Excluding transportation orders, however, growth was flat in January. Orders rose in primary metals but fell in fabricated metal products. Orders for machinery were roughly flat over January but 1.2% higher Y/Y. Similarly, orders for electrical equipment, appliances, and components were steady over January and higher on a Y/Y basis (by 3.2%). Orders for autos and parts were down on a monthly and Y/Y basis. Core capital goods orders (non-defense capital goods orders excluding aircraft), a proxy for business investment in long-lasting equipment, rose 0.8% in January. Compared to a year ago, headline orders were up by 4.3% and core business goods were up by 2.2%.
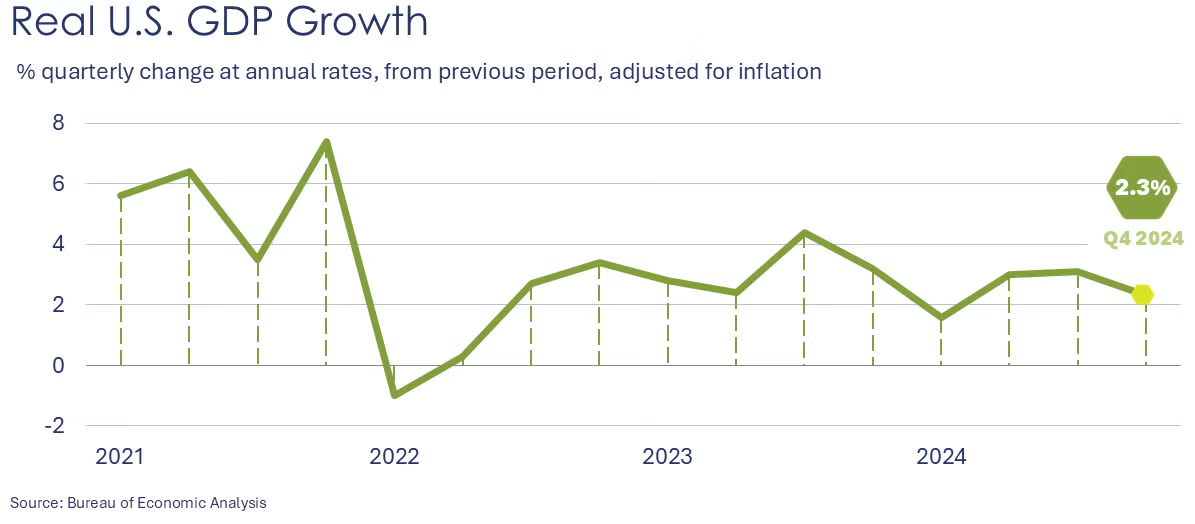
US GDP grew by a 2.3% seasonally adjusted annual rate (SAAR) in Q4 according to the second of three estimates provided by the Bureau of Economic Analysis. Compared to Q3, the deceleration in real GDP in Q4 primarily reflected downturns in investment and exports that were partly offset by an acceleration in consumer spending. Imports decreased.
Texas manufacturing activity contracted in February and the outlook deteriorated. The general business activity index of the Dallas Fed’s Texas Manufacturing Outlook Survey fell 22.4 points to -8.3 during the second month of the year. Production, capacity utilization, new orders, employment and hours worked declined. Growth in shipments decelerated. Finished goods inventories were drawn down. Input prices and prices received for finished goods rose over the month. Looking ahead over the next six months, the outlook weakened as companies anticipate deceleration in key indicators for their business in Texas including new orders and production.
The Richmond Fed manufacturing survey (which covers DC, MD, NC, SC, VA, and most of WV), indicated somewhat stronger activity in February, led by growth in shipments. New orders, which had been falling, stabilized and looking ahead manufacturers expect modest growth in demand over the coming six months. The prices paid component moderated while prices received picked up. Manufacturers expect both to rise over the short term.
Manufacturing activity in the Kansas City Fed’s district continued to fall in February. Firms decreased employment levels moderately this month but expect overall activity and employment to increase in the next six months. Amongst manufacturers’ comments, there were concerns about trade policy impacts, rising input costs, and weak demand. One manufacturer commented, “This is a time of uncertainty for manufacturers, very difficult to make business plans.”
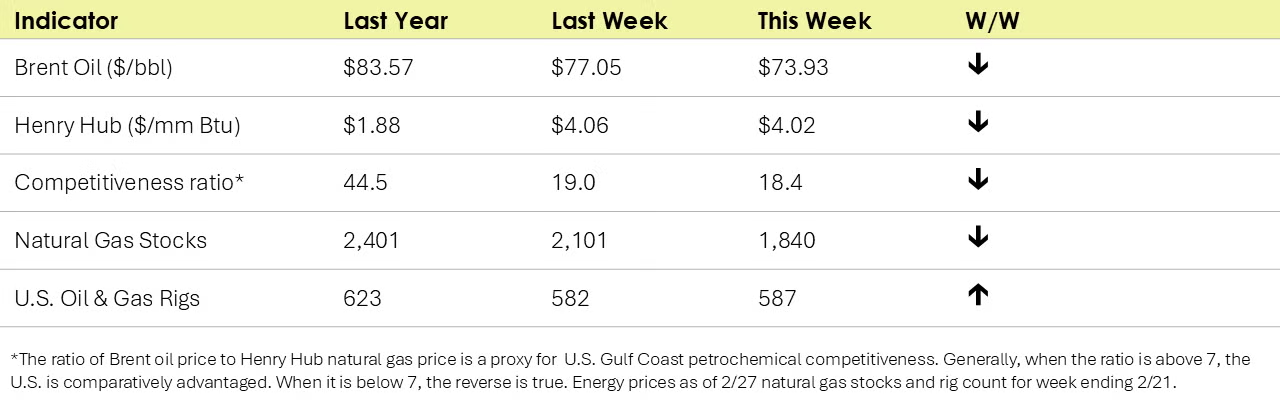
Both U.S. natural gas and oil prices eased from a week ago. Natural gas inventories fell by 261 BCF W/W and remains well below the 5-year average. The combined oil & gas rig count rose by 5 to 587, a level well below a year ago when it was 623.
Indicators for the business of chemistry suggest a yellow banner.

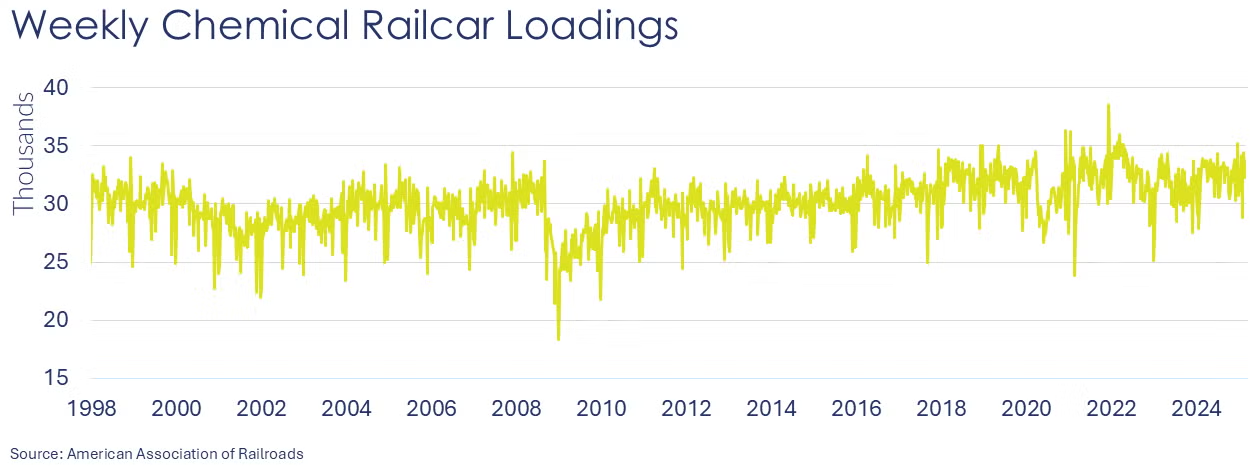
According to data released by the Association of American Railroads, chemical railcar loadings were up to 33,527 for the week ending February 22. Loadings were up 5.0% Y/Y (13-week MA), up (2.8%) YTD/YTD and have been on the rise for 7 of the last 13 weeks.
Note On the Color Codes
Banner colors reflect an assessment of the current conditions in the overall economy and the business chemistry of chemistry. For the overall economy we keep a running tab of 20 indicators. The banner color for the macroeconomic section is determined as follows:
Green – 13 or more positives
Yellow – between 8 and 12 positives
Red – 7 or fewer positives
There are fewer indicators available for the chemical industry. Our assessment on banner color largely relies upon how chemical industry production has changed over the most recent three months.
For More Information
ACC members can access additional data, economic analyses, presentations, outlooks, and weekly economic updates through ACCexchange: https://accexchange.sharepoint.com/Economics/SitePages/Home.aspx
In addition to this weekly report, ACC offers numerous other economic data that cover worldwide production, trade, shipments, inventories, price indices, energy, employment, investment, R&D, EH&S, financial performance measures, macroeconomic data, plus much more. To order, visit http://store.americanchemistry.com/.
Every effort has been made in the preparation of this weekly report to provide the best available information and analysis. However, neither the American Chemistry Council, nor any of its employees, agents or other assigns makes any warranty, expressed or implied, or assumes any liability or responsibility for any use, or the results of such use, of any information or data disclosed in this material.
Contact us at ACC_EconomicsDepartment@americanchemistry.com.