Running tab of macro indicators: 11 out of 20
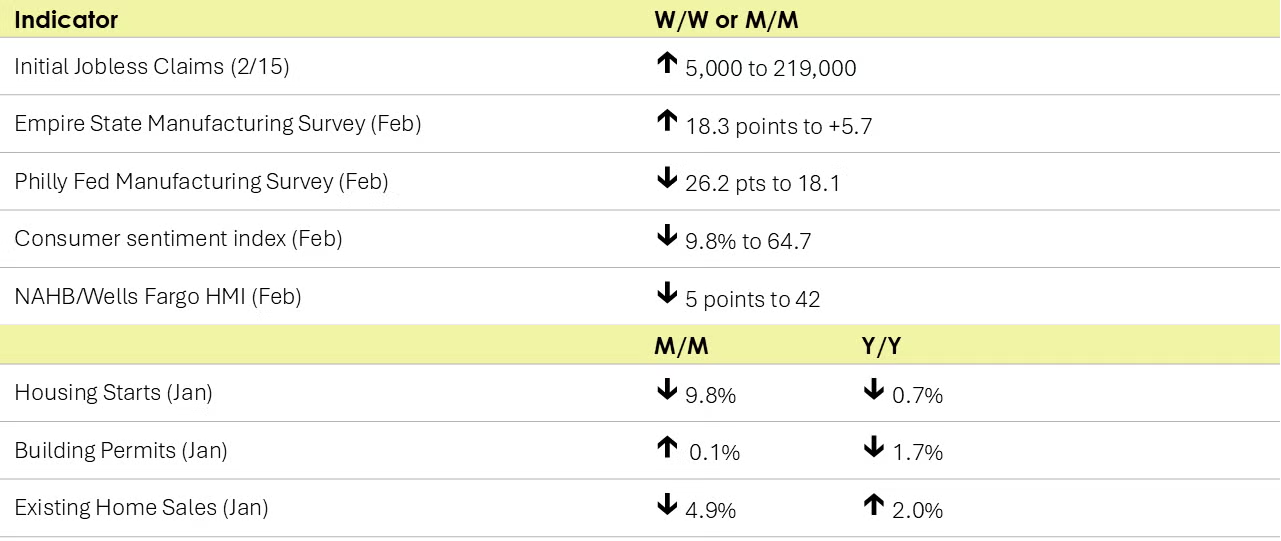
The number of new jobless claims rose by 5,000 to 219,000 during the week ending February 15. Continuing claims increased by 24,000 to 1.869 million, and the insured unemployment rate for the week ending February 8 was unchanged at 1.2%.

Following a surge in December, housing starts came down 9.8% to a 1.366-million-unit rate in January. Permits for future homebuilding remained steady over January, up just 0.1% from December to a 1.483-million-unit rate.
Existing home sales fell 4.9% over January though at a 4.08 million SAAR, they came in up 2.0% Y/Y. Affordability is limited by continued high mortgage rates and elevated prices. The median home was $396,900 nationwide, 4.8% higher than a year before and the 19th straight month of Y/Y price increases. Unsold inventories rose over January and represent about 3.5 months’ supply at the current sales pace, according to the National Association of REALTORS®.
The NAHB/Wells Fargo Housing Market Index (HMI) fell five points to 42 in February, the lowest level in five months. There was deterioration across all subcomponents – current sales conditions, sales expectations, and prospective buyer traffic.
An early look into manufacturing activity in February, the Empire State Manufacturing Survey showed that manufacturing activity expanded in New York State. The general business conditions index rose 18.3 points to + 5.7, with expansion in new orders, shipments, unfilled orders and inventories. Employment contracted, however. While firms remained optimistic, they were less optimistic compared to last month.
Manufacturing activity in the Philadelphia Fed’s region continued to expand though at a decelerated pace in February. General activity, shipments, employment and new orders continued to grow. Manufacturers reported that prices remain elevated. Firms in the region continue to expect future growth and plan to maintain capital spending levels.
The University of Michigan’s Consumer Sentiment Index slipped nearly 10% over the month to 64.7 in February. Inflation expectations built notably though they remain below previous peak readings when realized inflation was higher.
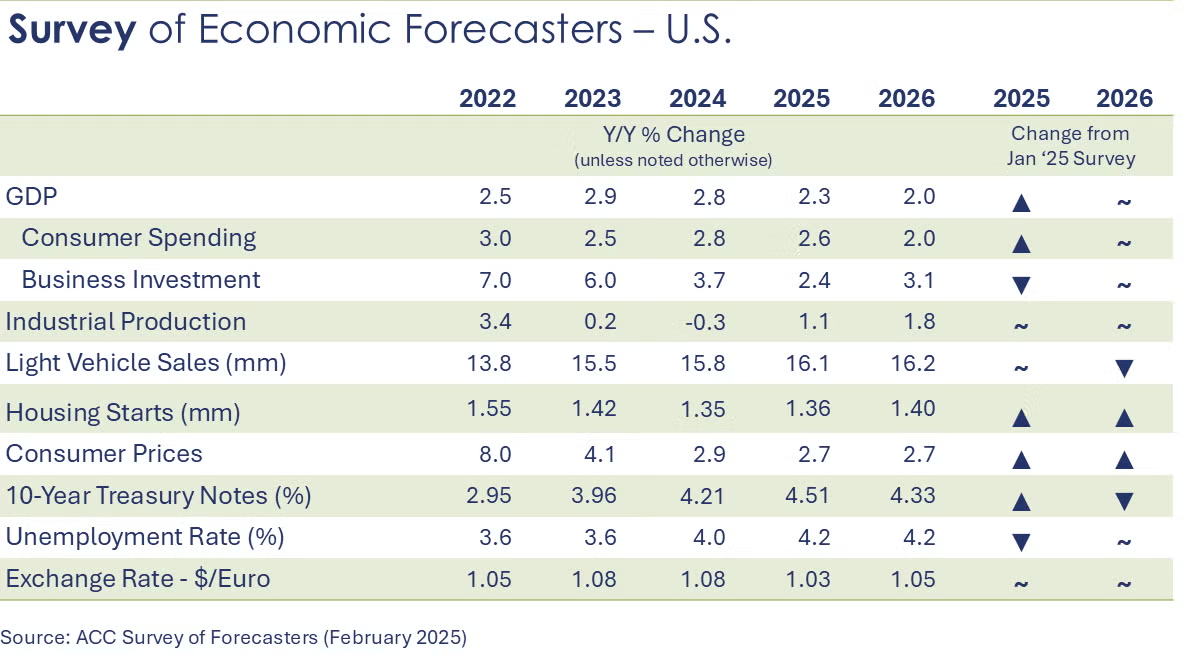
The U.S. economy continues to be on solid footing halfway through Q1. Compared to last month’s survey, expectations for 2025 improved across a number of indicators while expectations for 2026 were largely unchanged.
- U.S. GDP is expected to grow by 2.3% in 2025 and by 2.0% in 2026.
- Growth in consumer spending is expected to moderate to a 2.6% pace in 2025 before easing further to a 2.0% gain in 2026.
- Business investment growth is expected to slow to 2.4% in 2025 before rising to a 3.1% pace in 2026.
- Following a 0.3% decline in 2024, we look for industrial production to expand by 1.1% in 2025 and 1.8% in 2026. Growth is uneven among industries, however.
- Sales of autos and light trucks rose to 15.8 million in 2024 (still below trend). In 2025, vehicle sales are expected to rise to a 16.1 million pace and rise further to 16.2 million in 2026.
- Housing expectations for 2025 were steady compared to last month. Housing starts fell to 1.35 million in 2024 and are expected to be essentially flat in 2025 (up marginally to 1.36 million) as pressure remains on the 10-year Treasury which is tied to mortgage rates. A slight improvement is expected in 2026 with housing starts rising to 1.40 million.
- The unemployment rate is expected to move slightly higher as the labor market continues to rebalance, averaging 4.2% in both 2025 and 2026.
- Recent data shows slowing progress on inflation. In 2024, growth in the CPI slowed to 2.9%. Growth in consumer prices is expected to slow further to a 2.7% pace in both 2025 and 2026 (which was up from the January survey).
- With price pressures remaining in the economy, the Fed has signaled “higher for longer”. Expectations for the 10-year Treasury this year have trended higher.
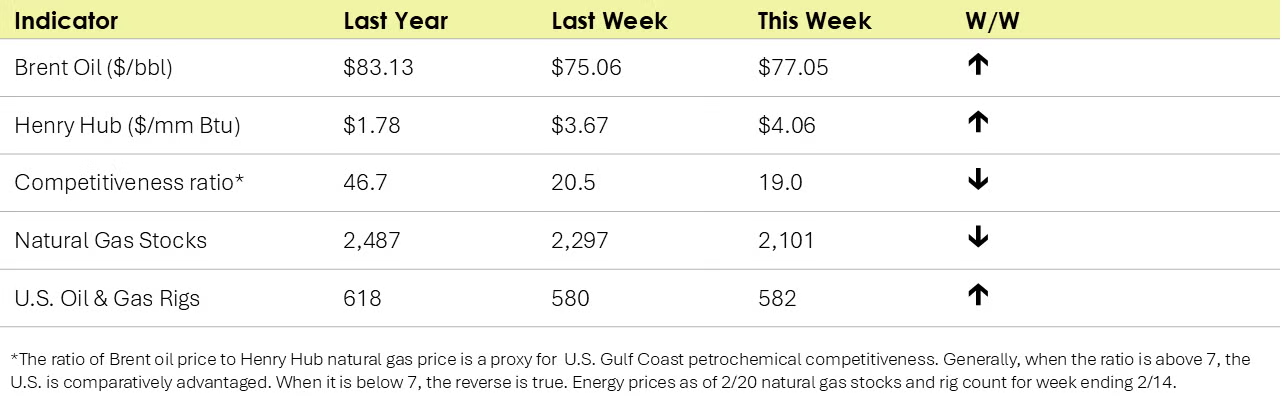
Oil prices have been trending higher despite a build in crude inventories. U.S. natural gas prices remain near their highest levels since December 2022 as colder-than-normal temperatures have driven up heating demand. Natural gas storage was down week-over-week and remains below the 5-year average. The combined oil and gas rig count rose for a third consecutive week, up two to 582.
Indicators for the business of chemistry suggest a yellow banner.

According to data released by the Association of American Railroads, chemical railcar loadings were down to 32,246 for the week ending February 15. Loadings were down -4.9% Y/Y (13-week MA), up (3.1%) YTD/YTD and have been on the rise for 7 of the last 13 weeks. While chemical railcar loadings dipped last week but the broader trend has been positive for quite some time. Our Y/Y 13-week moving average on chemical movements has been on a positive streak for a solid 61 weeks.

Note On the Color Codes
Banner colors reflect an assessment of the current conditions in the overall economy and the business chemistry of chemistry. For the overall economy we keep a running tab of 20 indicators. The banner color for the macroeconomic section is determined as follows:
Green – 13 or more positives
Yellow – between 8 and 12 positives
Red – 7 or fewer positives
There are fewer indicators available for the chemical industry. Our assessment on banner color largely relies upon how chemical industry production has changed over the most recent three months.
For More Information
ACC members can access additional data, economic analyses, presentations, outlooks, and weekly economic updates through ACCexchange: https://accexchange.sharepoint.com/Economics/SitePages/Home.aspx
In addition to this weekly report, ACC offers numerous other economic data that cover worldwide production, trade, shipments, inventories, price indices, energy, employment, investment, R&D, EH&S, financial performance measures, macroeconomic data, plus much more. To order, visit http://store.americanchemistry.com/.
Every effort has been made in the preparation of this weekly report to provide the best available information and analysis. However, neither the American Chemistry Council, nor any of its employees, agents or other assigns makes any warranty, expressed or implied, or assumes any liability or responsibility for any use, or the results of such use, of any information or data disclosed in this material.
Contact us at ACC_EconomicsDepartment@americanchemistry.com.

