MACROECONOMY & END-USE MARKETS
Running tab of macro indicators: 9 out of 20

The number of new jobless claims fell by 21,000 to 221,000 during the week ending March 1. Continuing claims increased by 42,000 to 1.897 million, and the insured unemployment rate for the week ending February 22 was unchanged at 1.2%.
Nonfarm payrolls rose by 151,000 in February, similar to the average monthly gain of 168,000 over the prior 12 months. In February, employment trended up in health care, financial activities, transportation and warehousing, and social assistance. Federal government employment declined. Employment showed little change in manufacturing. Average hourly earnings rose 4.0% Y/Y. The unemployment rate was roughly steady at 4.1% in February.
The U.S. goods and services deficit rose 34% month on month to $131.4 billion in January as a 10% increase in imports more than offset a 1.2% gain in exports. According to analysts at Wells Fargo, U.S. companies rushed to stockpile intermediate inputs ahead of the 25% tariffs on goods imported from Canada and Mexico and an additional tariff on goods from China.
Construction spending was down 0.2% in January. Spending on private residential projects was down 0.4% as a decline in multi-family projects offset gains in new single family. Spending on privately funded nonresidential projects was flat in January. Spending on manufacturing projects was down 0.3% but up 5.6% Y/Y. Publicly-funded construction spending rose slightly (up 0.1%). Overall construction spending was up 3.3% Y/Y.
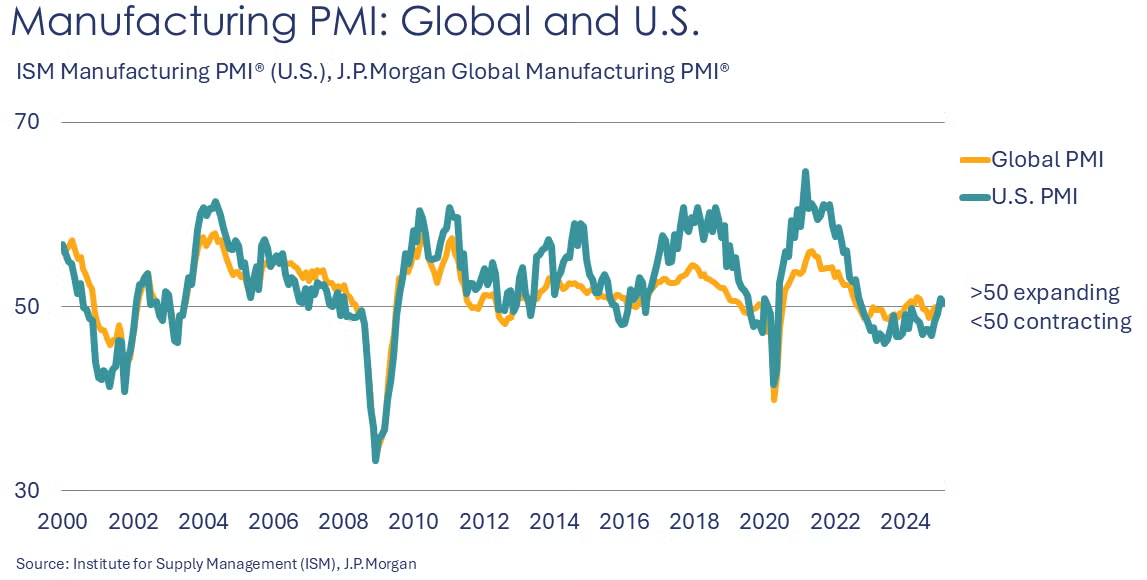
The ISM Manufacturing PMI® declined 0.6 percentage points to 50.3% in February. Above 50, the PMI reading indicates expansion in US manufacturing for the second month in a row and following a string of 26 months in contraction. The February gain was led by gains in production. New orders slipped overall as declines in domestic orders offset a gain in new export orders. Employment fell, prices rose, and inventories were drawn down. Order backlogs continued to contract. Supplier deliveries (a measure of “slack” in the supply chain) slowed at a faster rate. Ten industries reported expansion in February, including chemicals. Respondent comments included concerns about already rising prices and uncertainty related tariff impacts.
Looking abroad, the JP Morgan Global Manufacturing PMI® rose 0.5 points to 50.6% in February, indicating expansion in global manufacturing activity. Though, just above the 50-mark, the index was at an 8-month high. New orders and output expanded and expectations for future output rose. Export orders and employment continued to decline, however. Growing inflation was observed in both import and export prices. There was improvement in the US and China while weakness continued in the Euro Area, the UK and Japan.
Factory orders picked up in January, rising 1.7%. Durable goods orders (which are about half of orders) were up 3.2%. Orders for transportation equipment were up 9.9%. Orders for core business goods continued to expand. Overall, factory orders were up 4.3% Y/Y. Unfilled orders (a measure of the manufacturing pipeline) were up 0.2%. Manufacturing shipments rose 0.5% while inventories rose by 0.1%. The inventories-to-shipments ratio was unchanged at 1.46. Last January, the ratio was 1.49. Compared to a year ago, shipments were ahead by 2.7% while inventories were 1.0% higher.
Wholesale inventories rose 0.8% in January to a level up 1.2% Y/Y. Wholesale sales were down 1.3% in January to a level 3.5% higher Y/Y. As a result, the inventories-to-sales ratio at the wholesale stage was 1.33 (lower than 1.36 in January 2024).
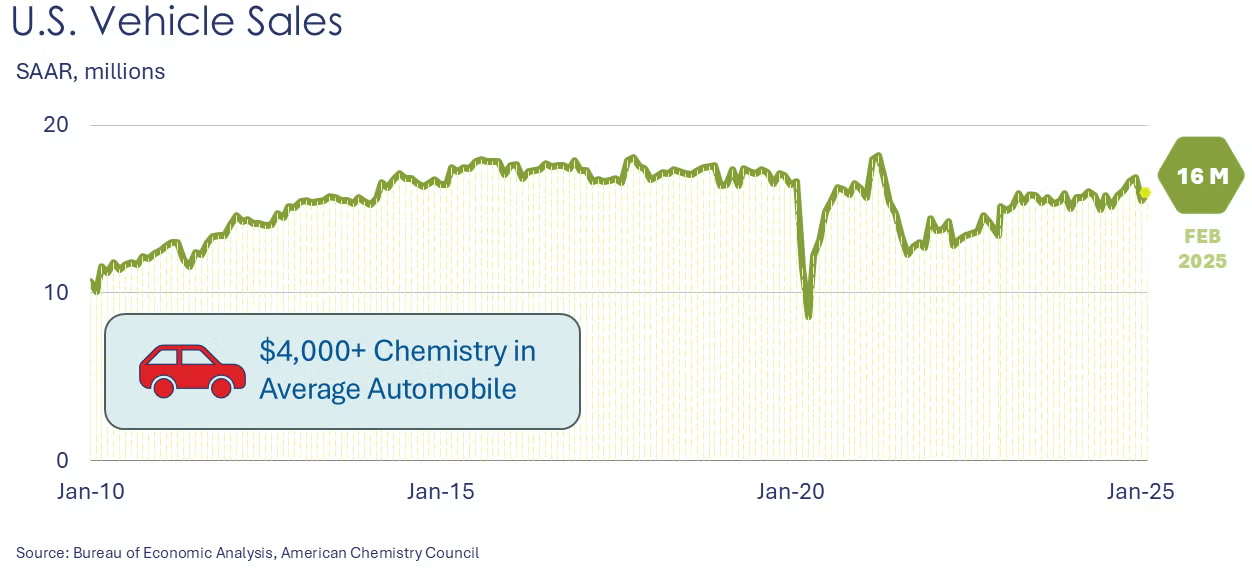
Light vehicle sales rose to a 16.0 million seasonally adjusted annual rate in February, up from a revised 15.0 M pace in January. Sales were higher in both autos and light-duty trucks.
The services sector continued to expand and at a faster pace in February. The ISM Services PMI® rose by 0.7 points to 53.5 with expansion in fourteen industries. Business activity/production, new orders, new export orders, order backlogs, inventories and employment rose. Imports contracted. Inventory sentiment remained “too high”.
ENERGY
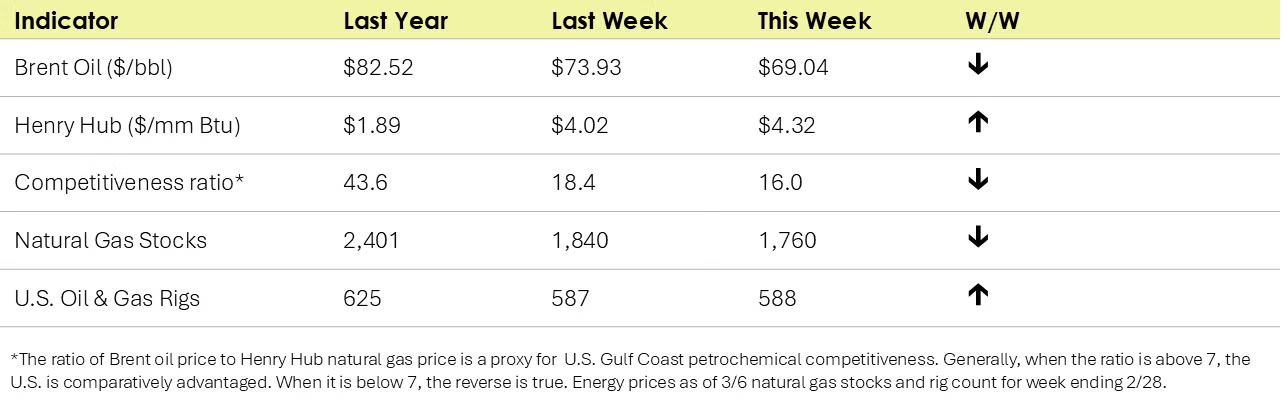
Brent crude oil prices dropped to their lowest level in over three years (reaching $68.22 per barrel before recovering slightly), reflecting pressure from trade tariffs between the U.S., Canada, Mexico and China; OPEC+ plans to raise output; and a larger than expected build in U.S. crude inventories. EIA’s weekly Natural Gas Storage report indicated a less-than-anticipated decrease in the volume of stored natural gas, implying a stronger demand for natural gas.
CHEMICALS
Indicators for the business of chemistry suggest a yellow banner.
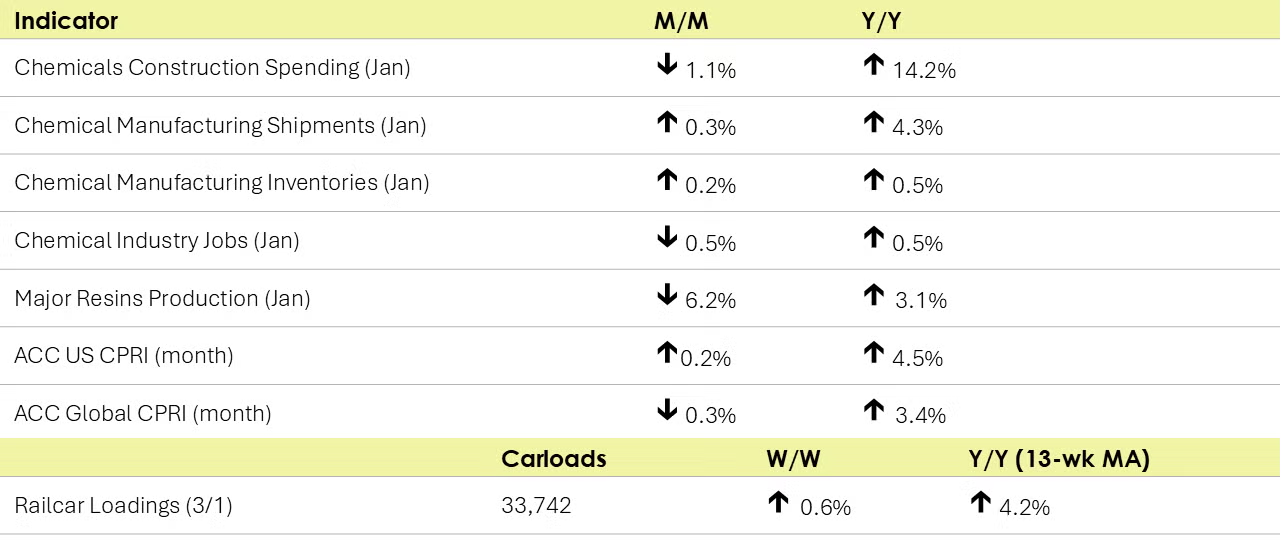
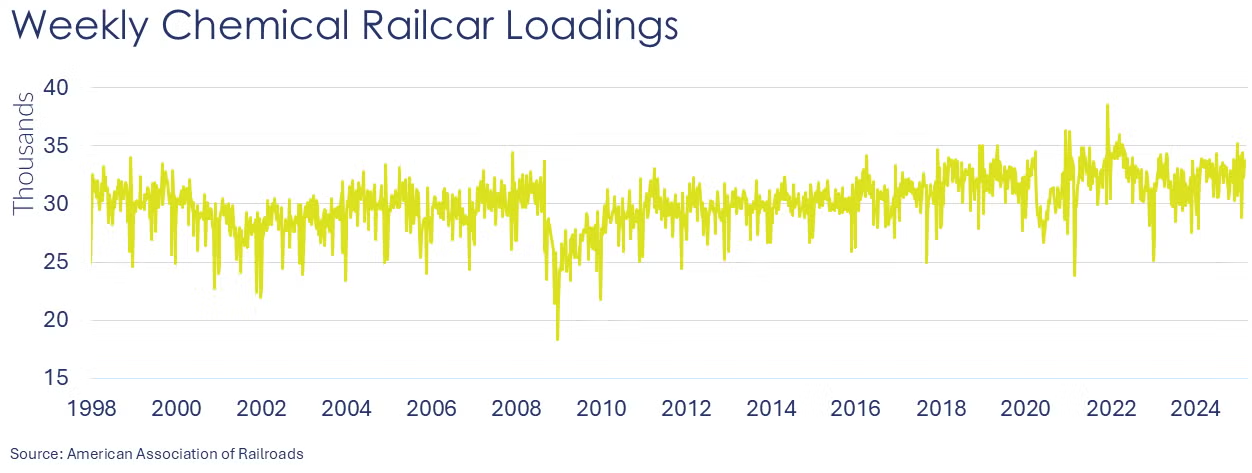
According to data released by the Association of American Railroads, chemical railcar loadings were up to 33,742 for the week ending March 1. Loadings were up 4.2% Y/Y (13-week MA), up (2.6%) YTD/YTD and have been on the rise for 8 of the last 13 weeks.
U.S. production of major plastic resins totaled 8.3 billion pounds during January 2025, a decrease of 6.2% compared to the prior month, and an increase of 3.1% Y/Y, according to ACC statistics. Sales and captive (internal) use of major plastic resins totaled 8.3 billion pounds during January 2025, a decrease of 9.3%, and a decrease of 1.2% Y/Y.
Within the details of the ISM Manufacturing PMI® report, the chemical industry reportedly expanded in February. New orders, production, inventories, raw materials prices, and import volumes rose. Supplier deliveries were reported to be slower. Customer inventories were reported as “too low” in February. Employment, new export orders, order backlogs were lower. One chemical industry respondent noted: “The tariff environment regarding products from Mexico and Canada has created uncertainty and volatility among our customers and increased our exposure to retaliatory measures from these countries.”
Chemical industry construction spending was down 1.1% in January at a $40.3 billion seasonally adjusted annual rate. Compared to last January, spending on chemical industry construction projects was up 14.2% Y/Y. In January, chemical industry construction spending was about 17% of total construction spending in manufacturing.
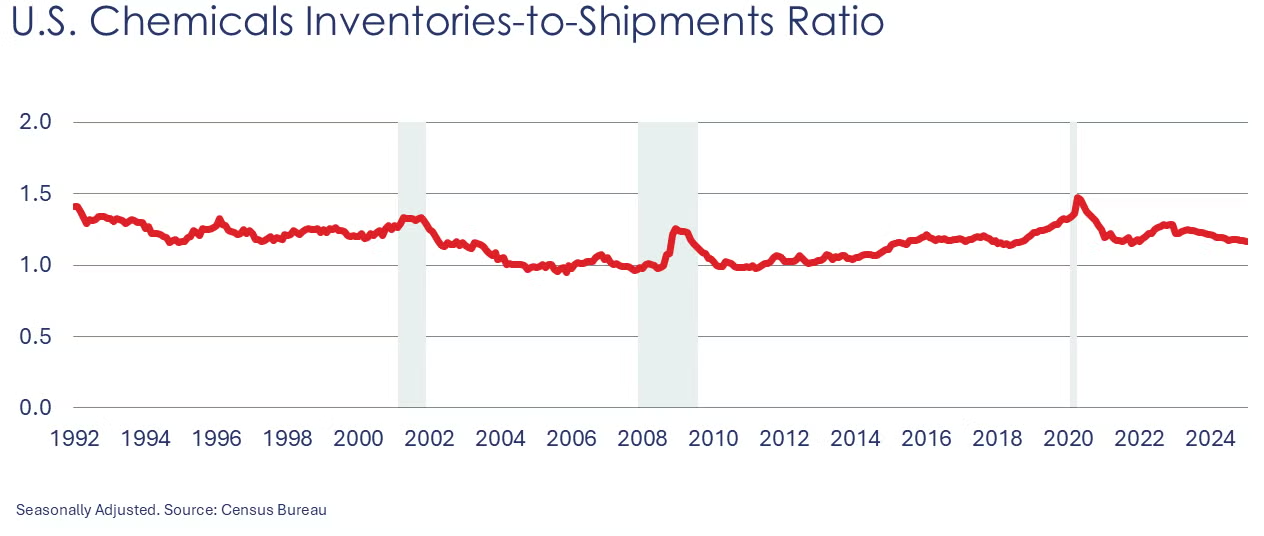
Chemical shipments were 0.3% higher in January. Declines in shipments of agricultural chemicals and coatings and adhesives were offset by gains in other chemicals. Chemical inventories rose slightly to a level up by 0.2%. Inventories rose across all categories. The inventories-to-sales ratio remained at 1.17 in January. A year ago, the ratio was 1.21. Shipments were up 4.3% Y/Y while inventories were up 0.5% Y/Y.
Chemical industry jobs fell 0.5% in January to 548,300, a level up 0.5% Y/Y. Employment in plastic resin manufacturing eased, however, off 0.2% to 60,900, a level 0.7% higher than last January. (Note that data at the detailed industry level are lagged one month behind the headline jobs report.)
In February, combined chemical and pharmaceutical jobs held steady at 900,000, a level up 0.7% Y/Y. Gains in the number of production workers offset a decline in supervisory & non-production workers. Average hourly wages rose at a 4.1% Y/Y rate. The average workweek increased from 41.2 hours to 41.7 hours in February.
The ACC’s Global Chemical Production Regional Index (Global CPRI) opened the year 2025 with a slight decline of 0.3%. All regions experienced a decrease in production, except for North America, where output saw an increase. In China, production stalled in January due to the Lunar New Year celebrations, although China's weakening Purchasing Manager Index (PMI) may indicate slower growth in the coming months. European production continued to weaken, impacted by sluggish performance in the manufacturing sector. In South America, production also slowed this month; however, year-over-year growth remained positive as economic conditions continued to improve in the region. Overall, all segments declined, but year-over-year production rose by 3.4%.
The U.S. CPRI opened the year 2025 with a 0.2% increase. This index measures chemical production trends based on a three-month moving average to smooth out month-to-month volatility. Production increased across all U.S. regions, with the Mid-Atlantic and Northeast regions experiencing the largest gains. Overall, the U.S. CPRI is 4.5% higher than it was a year ago.
Note On the Color Codes
Banner colors reflect an assessment of the current conditions in the overall economy and the business chemistry of chemistry. For the overall economy we keep a running tab of 20 indicators. The banner color for the macroeconomic section is determined as follows:
Green – 13 or more positives
Yellow – between 8 and 12 positives
Red – 7 or fewer positives
There are fewer indicators available for the chemical industry. Our assessment on banner color largely relies upon how chemical industry production has changed over the most recent three months.
For More Information
ACC members can access additional data, economic analyses, presentations, outlooks, and weekly economic updates through ACCexchange: https://accexchange.sharepoint.com/Economics/SitePages/Home.aspx
In addition to this weekly report, ACC offers numerous other economic data that cover worldwide production, trade, shipments, inventories, price indices, energy, employment, investment, R&D, EH&S, financial performance measures, macroeconomic data, plus much more. To order, visit http://store.americanchemistry.com/.
Every effort has been made in the preparation of this weekly report to provide the best available information and analysis. However, neither the American Chemistry Council, nor any of its employees, agents or other assigns makes any warranty, expressed or implied, or assumes any liability or responsibility for any use, or the results of such use, of any information or data disclosed in this material.
Contact us at ACC_EconomicsDepartment@americanchemistry.com.