MACROECONOMY & END-USE MARKETS
Running tab of macro indicators: 12 out of 20
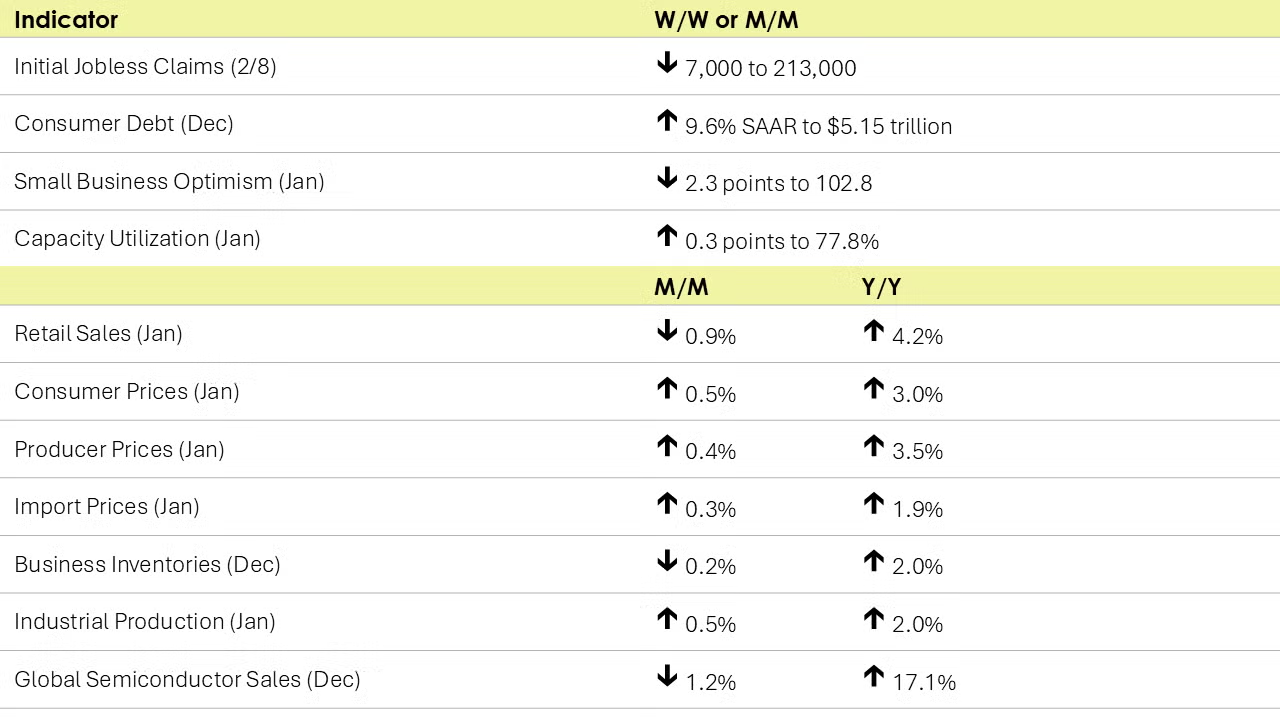
The number of new jobless claims fell by 7,000 to 213,000 during the week ending February 8. Continuing claims fell by 36,000 to 1.85 million, and the insured unemployment rate for the week ending February 1 was unchanged at 1.2%.
Retail and food service sales fell more than expected in January, down 0.9%. Sales were broadly lower, though there were gains at general merchandise stores, grocery stores, gas stations, and restaurants. Severe winter weather, fires, and a strong December (up 0.7%) likely contributed to the pullback. Compared to a year ago, retail sales were up 4.2% Y/Y.
Combined business inventories contracted by 0.2% in December, below expectations for flat growth. Declines in wholesale and retail inventories offset an increase in manufacturers’ inventories. Combined business sales rose 0.8%, however, with solid gains across all three major segments. The inventories-to-sales ratio eased from 1.37 in November to 1.35 in December, its lowest level since September 2023. A year ago, the ratio was 1.37. Compared to last December, business inventories were up 2.0% Y/Y while sales were up 3.1% Y/Y.
Non-mortgage consumer debt surged in December, up by a 9.6% seasonally adjusted annual rate to a record high $5.15 trillion. Credit card debt (e.g., revolving debt) saw the largest gain (up at a 20.2% annual rate) while nonrevolving debt (such as car loans, student loans, etc.) rose by a 5.8% rate. The late timing of Thanksgiving (which may have pushed holiday spending into December) and pre-buying of durable goods in advance of expected tariffs likely accounted for a portion of the large increase.
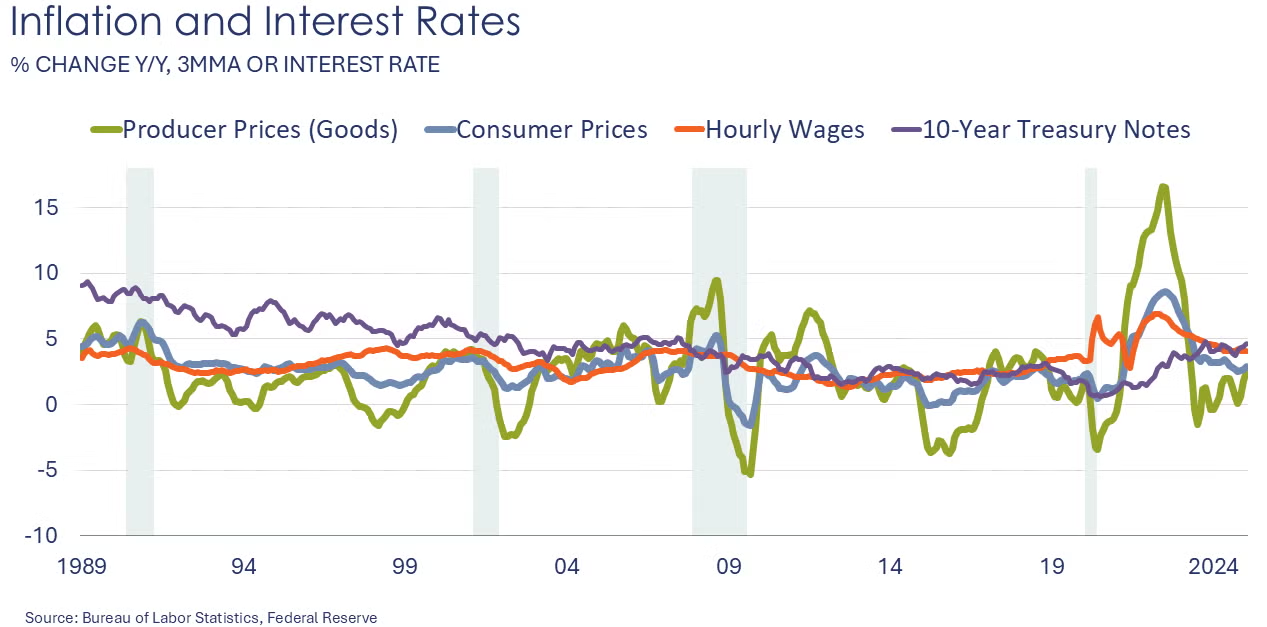
Consumer prices rose by 0.5% in January, higher than expected and the largest monthly jump since August 2023. Prices were higher across a number of categories, including gasoline, groceries, and housing (which combined, make up nearly half of all consumer purchases). Excluding the volatile food and energy components, core consumer prices rose 0.4% during the month and were up 3.3% Y/Y. Growth in core consumer prices has hovered in a narrow band around 3.2%-3.3% since June 2024. Headline consumer prices were up 3.0% Y/Y, the fourth consecutive gain in the Y/Y comparison.
Producer prices rose by 0.4% in January, also a little higher than expected. The gain was led by sharply higher prices for food (including eggs) and energy products. Price gains for services moderated, however, compared to December. Compared to a year ago, headline producer prices were up 3.5% Y/Y (same as December) and core producer prices were up 3.4% Y/Y (slightly lower than in November and December).
Reflecting higher prices for imported fuels, import prices rose 0.3% in January, the largest monthly gain since April. Core import prices continued to edge higher, up 0.1%. Export prices also rose in January, up 1.3%. Compared to a year ago, import prices were up 1.9% Y/Y while export prices were up 2.7% Y/Y.
Industrial production rose by 0.5% in January, despite disruptions related to winter storm Enzo that brought severe winter weather across much of the U.S. The gain in overall industrial production was led by a gain in utility output. Mining and manufacturing output eased. The largest declines in production were in motor vehicles, printing, primary metals, and plastic & rubber products. The largest gains were in aerospace, apparel, nonmetallic mineral products, computers & electronics, and furniture. Light vehicle assemblies fell to the lowest pace since July. Capacity utilization also improved, up by 0.3 points to 77.8%. A year ago, capacity utilization was 77.2%. Over the past year, overall industrial capacity has grown 1.2% Y/Y.
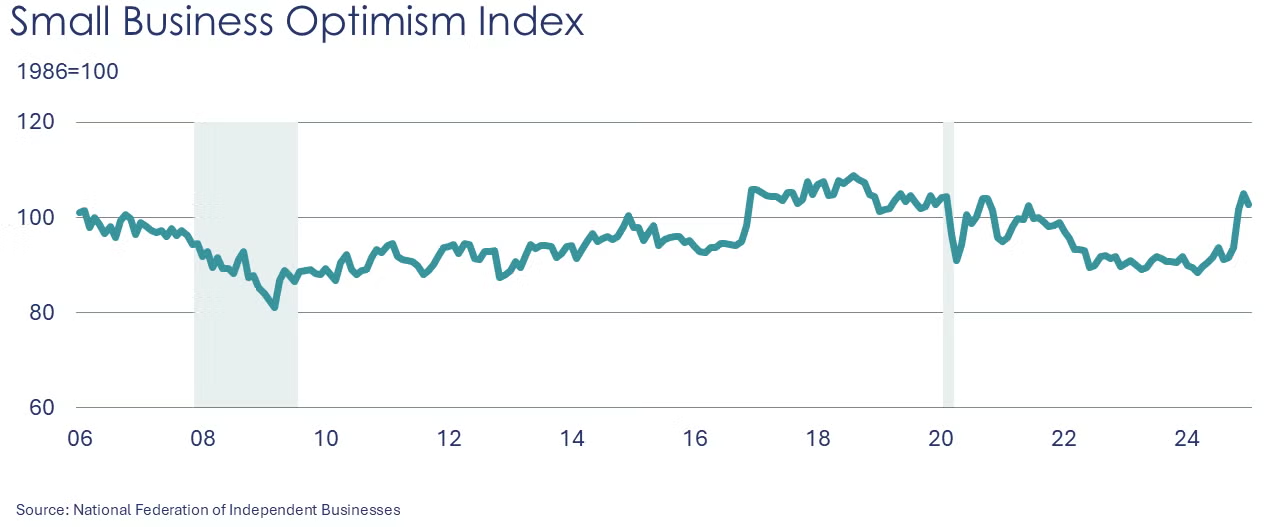
Small business optimism eased in January, falling 2.3 points to 102.8. Despite the decline, small business optimism remained above its long-term average for a third consecutive month. Uncertainty grew during January as the uncertainty index rose to its third-highest level on record. Inflation matched labor quality as the top issue facing small business owners.
Global semiconductor sales eased in December, off 1.2%. Sales were lower in all regions except the Americas which rose 3.2%. Compared to a year ago, sales were up 17.1% Y/Y, with sales in the Americas up by 56.3% Y/Y.
ENERGY

- Oil prices were higher compared to last week despite hopes of a Russia-Ukraine ceasefire.
- U.S. natural gas prices rose following a larger-than-expected inventory withdrawal.
- The combined oil and gas rig count rose by three to 580.
CHEMICALS
Indicators for the business of chemistry suggest a yellow banner.
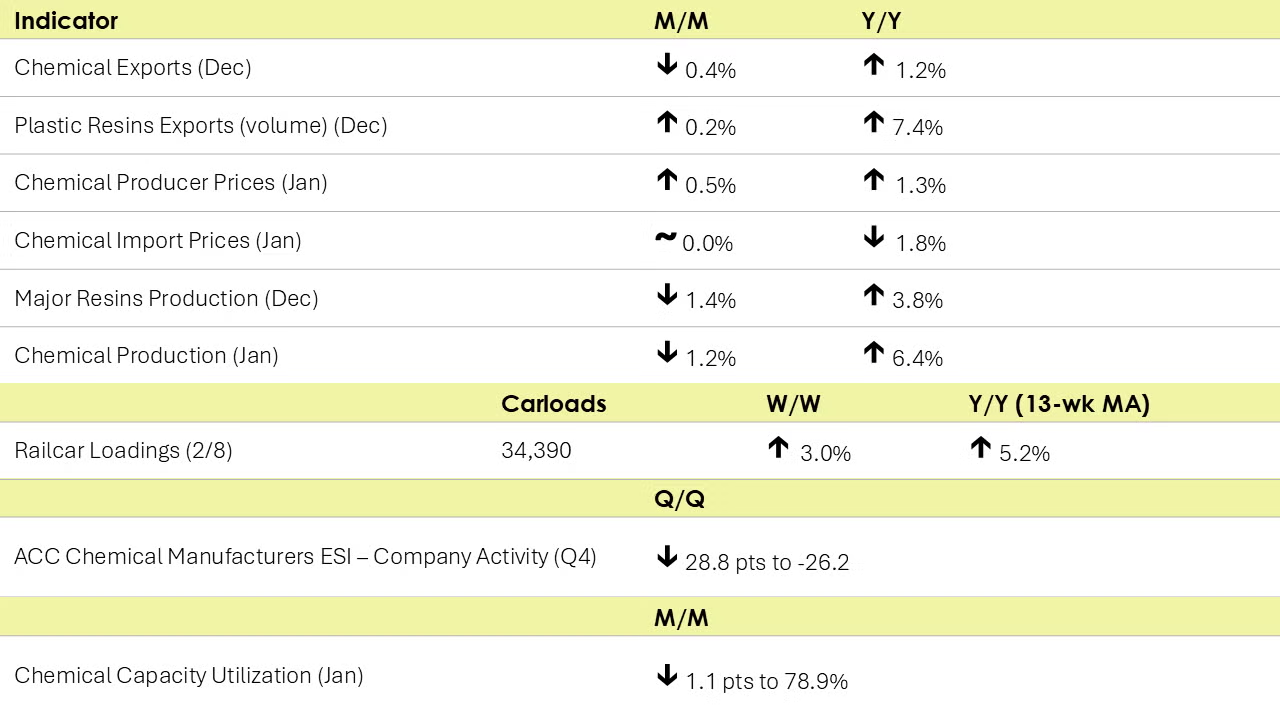
According to data released by the Association of American Railroads, chemical railcar loadings were up to 34,390 for the week ending February 8. Loadings were up 5.2% Y/Y (13-week MA), up (4.6%) YTD/YTD and have been on the rise for 8 of the last 13 weeks.
Chemical manufacturers’ overall level of activity deteriorated in the fourth quarter but is expected to recover through the first half of 2025 according to companies participating in ACC’s quarterly Chemical Manufacturing Economic Sentiment Index survey. ACC’s index, based on companies’ assessment of their activity level overall (e.g., sales, production, output) fell, losing momentum in Q4 as chemical manufacturers reported weak demand in major customer markets and challenging economic conditions in the U.S. and abroad. Most companies described major customer market demand as having either flattened or deteriorated in Q4. The volume of new orders index fell in Q4, reflecting declines in both domestic and foreign orders. The outlook is good though. Companies see business conditions improving over the coming six months and for the first time, that optimism includes expectations for some relief in the level of regulatory burden.
U.S. production of major plastic resins totaled 8.8 billion pounds during December 2024, a decrease of 1.4% compared to the prior month, and an increase of 3.8% compared to the same month in 2023, according to ACC statistics. Year-to-date production was 102.2 billion pounds, a 5.7% increase as compared to the same period in 2023.
Sales and captive (internal) use of major plastic resins totaled 9.1 billion pounds during December 2024, an increase of 7.6% compared to the prior month, and a 12.0% increase from the same month one year earlier. Year-to-date sales and captive use were 101.5 billion pounds, a 6.4% increase as compared to the same period in 2023.
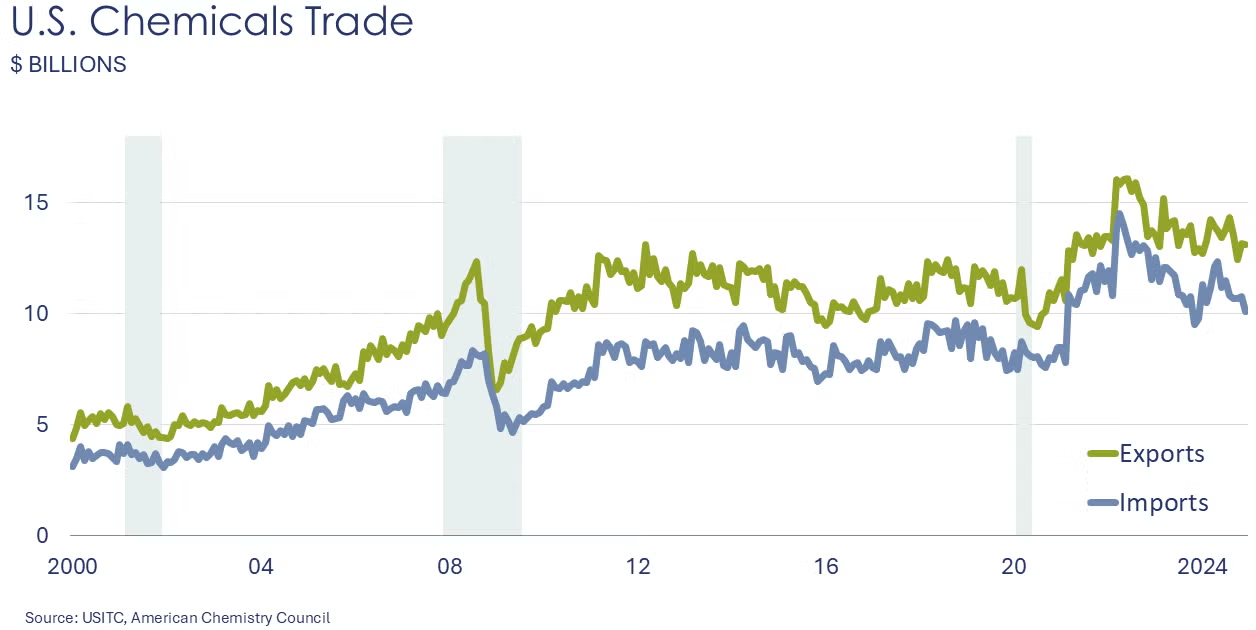
Chemical exports rose 0.4% in December as broad declines were offset by gains in inorganics and bulk petrochemicals and derivatives. Chemical exports were up 1.2% to $161.8 billion in 2024. Chemical imports declined 6.5% in December, reflecting lower imports of inorganics, petrochemicals, and most specialties. Chemical imports rose 3.0% over 2024 to $133.2 billion. The U.S. trade surplus in chemicals increased over December (by $648 million) and was $28.6 billion for the year. Plastic resin exports increased 0.2% in December and were up 7.4% Y/Y in volume terms. On a USD value basis, plastic resin exports were down 4.0% in December and up 1.6% Y/Y. Resin exports rose 2.5% over 2024 to $38.5 billion.
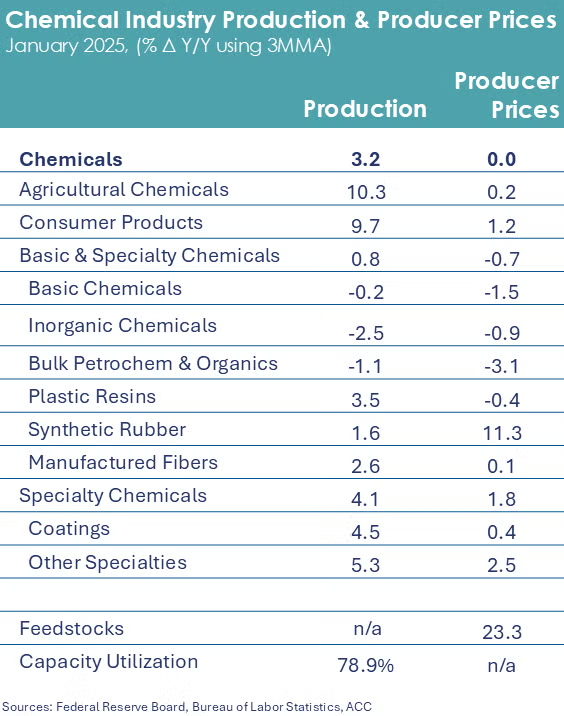
After solid gains during Q4, chemical production fell back sharply in January, down 1.2%. The decline in output was triggered by disruptions related to winter storm Enzo that brought temperatures in the Gulf Coast below freezing for days. Chemical output fell across a number of sectors, with notable declines in organic chemicals, plastic resins, synthetic rubber, manufactured fibers, coatings, and agricultural chemicals. Those declines were offset by gains in inorganic chemicals, other specialty chemicals, and consumer products.
After falling for five consecutive months, chemical prices rose 0.5% in January. Prices were higher across broad categories, with the exception of plastic resins which continued to ease, down by 0.4%. The largest gains were in other specialty chemicals and inorganic chemicals. Prices for synthetic rubber were flat. Compared to a year ago, chemical prices were up by 1.3%.
Chemical import prices were flat in January, following a small gain in December. Compared to a year ago, chemical import prices remained off, down by 1.8% Y/Y. Prices for chemical exports rose 0.7% and were up 4.1% Y/Y.
Note On the Color Codes
Banner colors reflect an assessment of the current conditions in the overall economy and the business chemistry of chemistry. For the overall economy we keep a running tab of 20 indicators. The banner color for the macroeconomic section is determined as follows:
Green – 13 or more positives
Yellow – between 8 and 12 positives
Red – 7 or fewer positives
There are fewer indicators available for the chemical industry. Our assessment on banner color largely relies upon how chemical industry production has changed over the most recent three months.
For More Information
ACC members can access additional data, economic analyses, presentations, outlooks, and weekly economic updates through ACCexchange: https://accexchange.sharepoint.com/Economics/SitePages/Home.aspx
In addition to this weekly report, ACC offers numerous other economic data that cover worldwide production, trade, shipments, inventories, price indices, energy, employment, investment, R&D, EH&S, financial performance measures, macroeconomic data, plus much more. To order, visit http://store.americanchemistry.com/.
Every effort has been made in the preparation of this weekly report to provide the best available information and analysis. However, neither the American Chemistry Council, nor any of its employees, agents or other assigns makes any warranty, expressed or implied, or assumes any liability or responsibility for any use, or the results of such use, of any information or data disclosed in this material.
Contact us at ACC_EconomicsDepartment@americanchemistry.com.

