Running tab of macro indicators: 14 out of 20
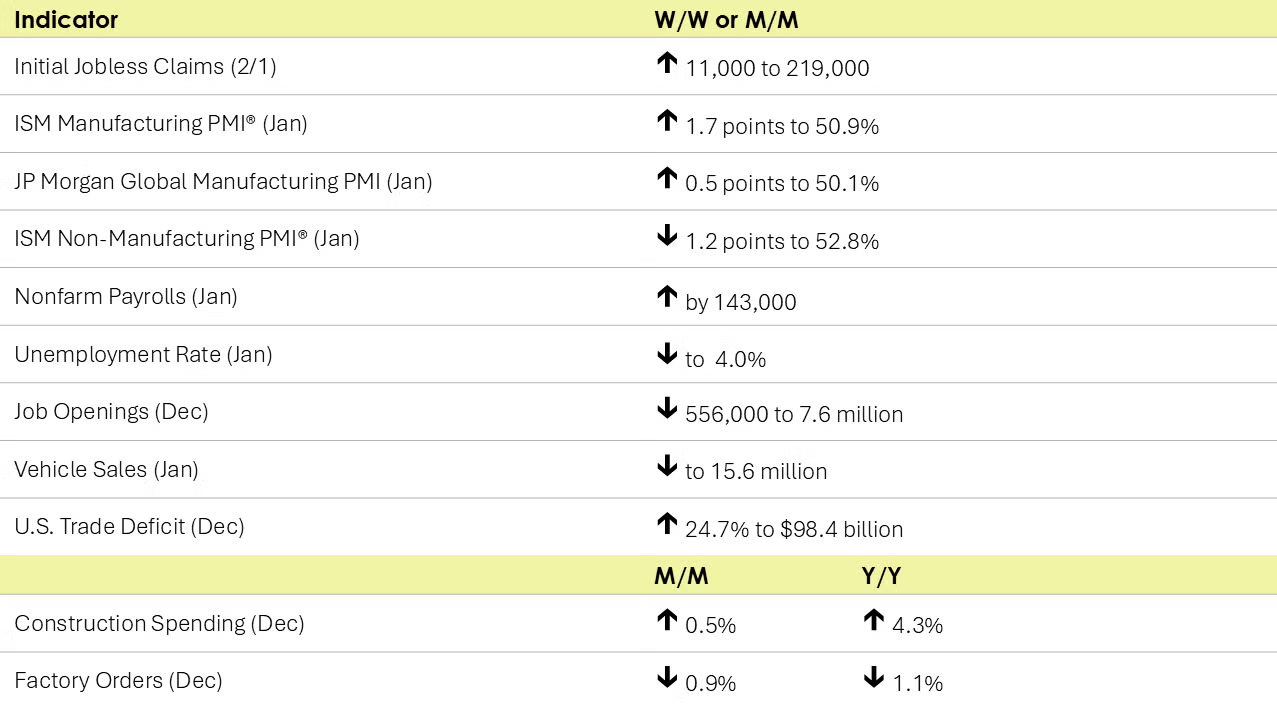
The number of new jobless claims rose by 11,000 to 219,000 during the week ending February 1. Continuing claims increased by 36,000 to 1.886 million, and the insured unemployment rate for the week ending January 25 was unchanged at 1.2%.
Nonfarm payrolls rose by 143,000 in January, down from an upwardly revised 307,000 gain in December. Manufacturing employment was higher, as was construction. Services employment was also higher, with the exception of business and professional services (including temporary help services which continued to contract). Government employment also rose in January, but the reference period was before Trump’s inauguration. Average hourly earnings rose 4.1% Y/Y, the same as in December. The unemployment rate was estimated at 4.0%, down from December’s 4.1% which was based on older population estimates.
BLS noted that neither the California wildfires nor the severe winter weather in January had a “discernible effect” on the data. The release of the January data also included revisions to previous estimates.
Job openings decreased to 7.6 million (-556,000) in December and were down by 1.3 million over the year. The ratio of job openings to the number of unemployed people was 1.1 in December – down from 1.4 in December 2023. The quits rate (a measure of workers’ willingness to leave a job) was unchanged.
The U.S. trade deficit in goods and services was $98.4 billion in December, a 24.7% gain reflecting stronger imports and a decline in exports. For the year, the goods and services deficit increased $133.5 billion, or 17.0%, from 2023. Exports increased by $119.8 billion or 3.9%. Imports increased by $253.3 billion or 6.6%. The goods deficit in December ($123.0 billion) was the highest on record.
Construction spending rose by 0.5% in December with a strong gain in spending on private residential projects (led by single-family and improvements). Spending on privately funded nonresidential projects also edged higher (led by commercial). Publicly-funded construction spending eased for a second month. Overall construction spending was up 4.3% Y/Y.
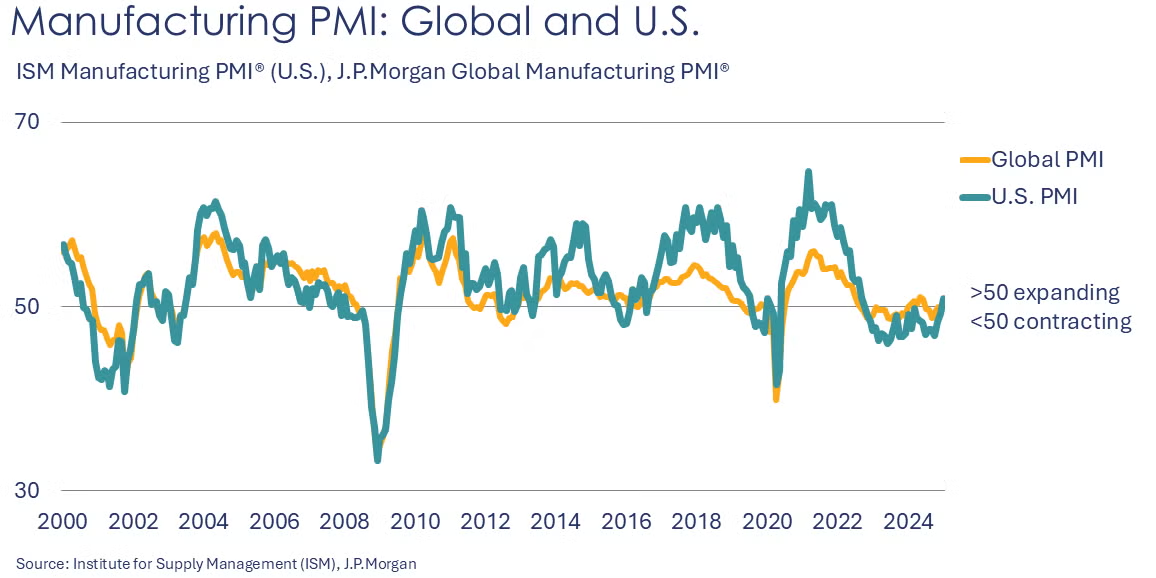
Following 26 months of contraction, the ISM Manufacturing PMI® rose 1.7 points to 50.9% in January. There were gains across new orders, production and employment. Order backlogs continued to contract. Raw materials inventories also continued to move lower and customer inventories were assessed as “too low”. Supplier deliveries (a measure of “slack” in the supply chain) slowed at a faster rate in January. Eight industries reported expansion in January, including chemicals. The other seven included textiles, primary metals, petroleum products, machinery, transportation equipment, rubber & plastic products, electrical equipment & appliances. Among the comments, respondents noted higher than expected orders and cautious optimism about recovery in goods demand.
Looking abroad, the JP Morgan Global Manufacturing PMI® rose 0.5 points to 50.1% in January, suggesting a slight expansion in global manufacturing activity. New orders and output expanded and expectations for future output rose. Export orders and employment continued to decline, however. Improvement in the US and China were offset by continued weakness in the Euro Area and Japan.
Factory orders slipped in December, down 0.9%. Durable goods orders (which are about half of orders) were down 2.2%. Orders for transportation equipment were down 7.4%, reflecting a drop in non-defense aircraft. Orders rose slightly for motor vehicles and IT equipment. Overall, factory orders were down 1.1% Y/Y. Unfilled orders (a measure of the manufacturing pipeline) were down 0.5% following five months of gains. Manufacturing shipments rose 0.6% while inventories rose by 0.4%. The inventories-to-shipments ratio edged down to 1.46. Last December, the ratio was 1.48. Compared to a year ago, shipments were ahead by 1.9% while inventories were 0.8% higher.
Wholesale inventories edged slightly lower in December (down 0.5%) to a level down 0.1% Y/Y. Wholesale sales were up 1.0% in December to a level 2.8% higher Y/Y. As a result, the inventories-to-sales ratio at the wholesale stage was 1.31 (down compared to 1.35 in December 2023).
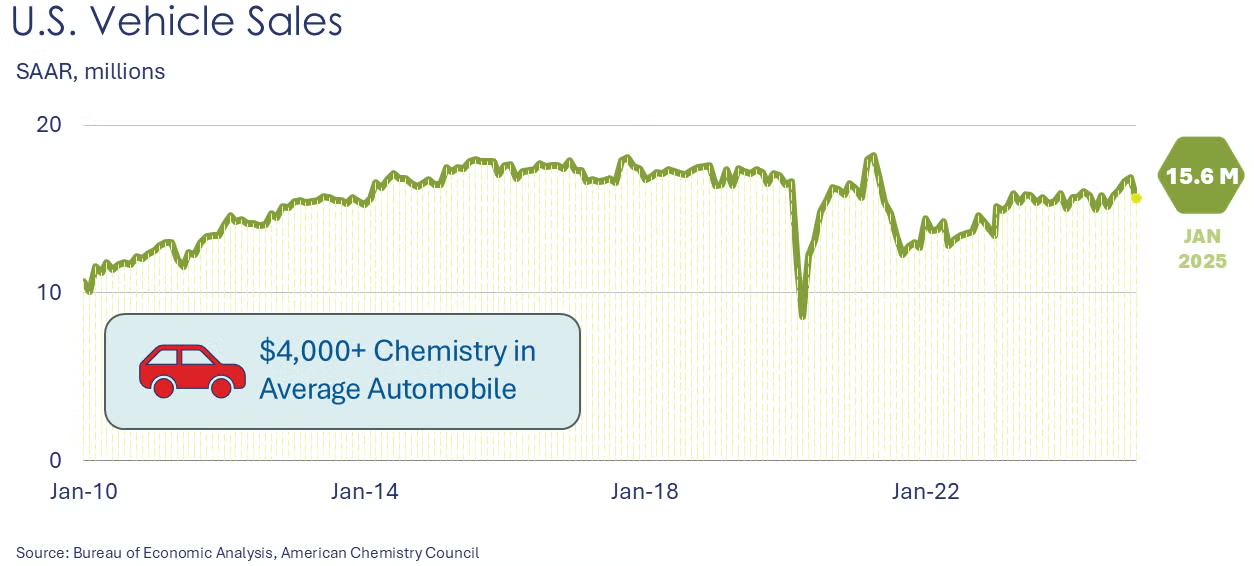
Light vehicle sales fell to a 15.6 million seasonally adjusted annual rate in January following gains over the last four months of 2024. Sales were lower in both autos and light-duty trucks. Bitterly cold weather across much of the U.S. likely contributed to the decline in sales.
The services sector continued to expand though at a slower pace in January. The ISM Services PMI® declined by 1.2 points to 52.8 with expansion in fourteen industries. Business activity/production and new orders rose at slower rates. Employment picked up and inventories contracted. Imports contracted and new export orders rose. Order backlogs contracted and inventory sentiment remained “too high”.
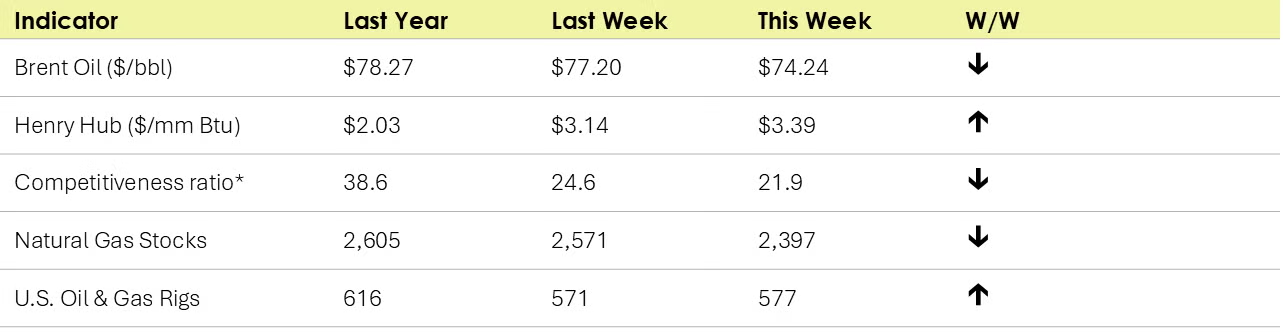
- Oil prices were lower than last week on the announcement of further US sanctions on Iranian oil exports to China.
- U.S. natural gas prices were higher this week due to a chillier US forecast.
- Following three weeks of declines, the combined oil & gas rig count rose by six to 577.
Indicators for the business of chemistry suggest a yellow banner.
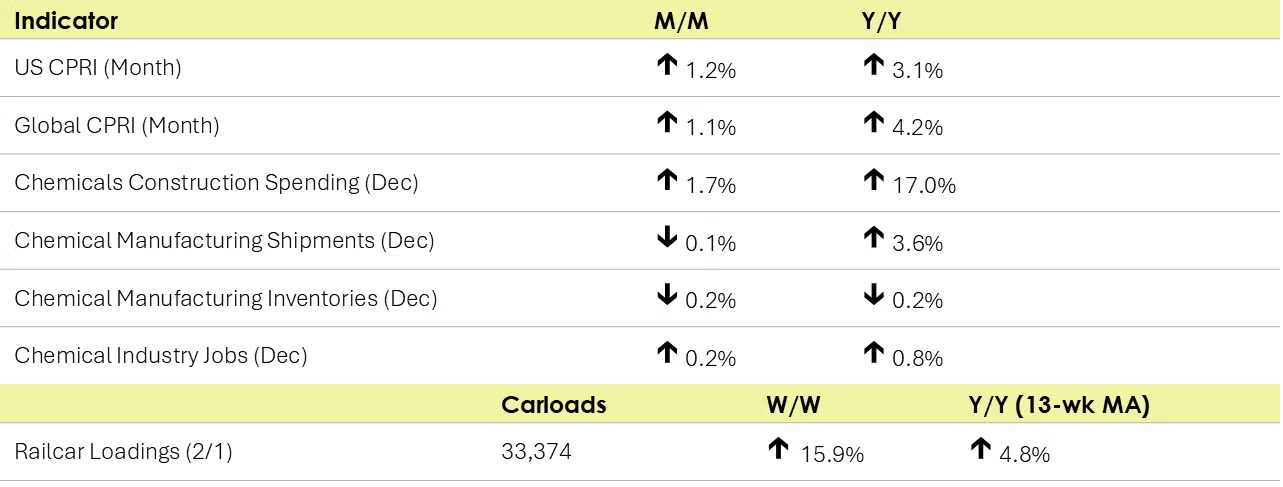
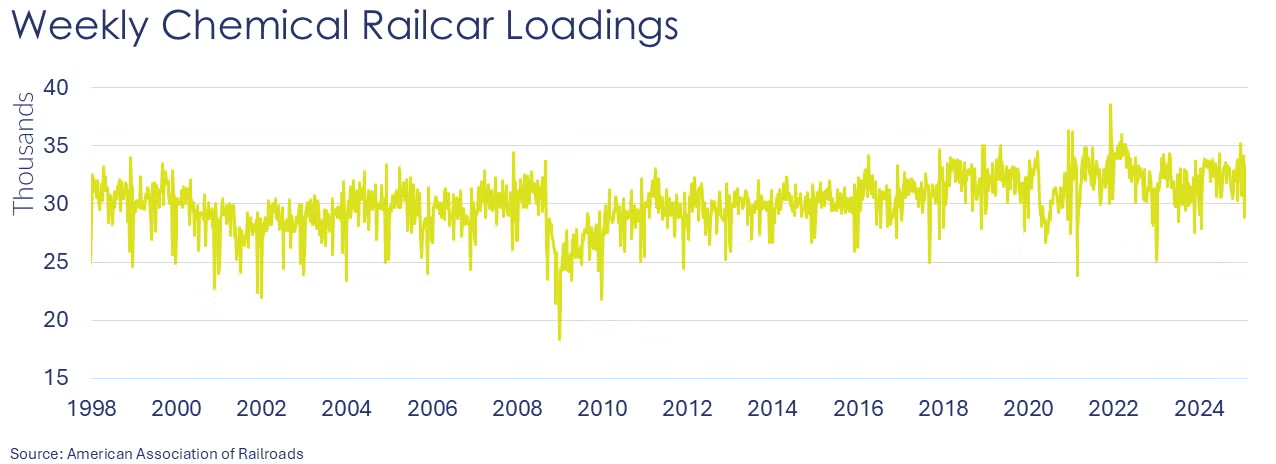
According to data released by the Association of American Railroads, chemical railcar loadings were up to 33,374 for the week ending February 1. Loadings were up 4.8% Y/Y (13-week MA), up (4.8%) YTD/YTD and have been on the rise for 7 of the last 13 weeks.
Within the details of the ISM Manufacturing PMI® report, the chemical industry reportedly expanded in January. New orders, production, export orders and employment rose. Supplier deliveries were reported to be faster. Inventories, imports and order backlogs were lower, however. One chemical industry respondent noted: “Customer orders slightly stronger than expected. […] No International Longshoremen’s Association strike is a tremendous help.”
Chemical industry construction spending was up 1.7% in December at a $40.4 billion seasonally adjusted annual rate. Compared to last December, spending on chemical industry construction projects was up 17.0% Y/Y. In December, chemical industry construction spending was about 17% of total construction spending in manufacturing.
Following a gain in November (0.7%), ACC’s Global Chemical Production Regional Index (Global CPRI) ended 2024 with a 1.1% increase. All regions saw gains, with North America and Asia leading while stabilizing. China’s production finished the year with an impressive 2.0% gain as U.S. importers likely front-loaded goods ahead of possible tariffs. U.S. production ended the year with a 1.2% increase as new orders and export demand rose (ISM Manufacturing PMI). All segments showed strength, with basic chemicals leading. Global chemicals production growth was up 4.2% Y/Y.
Following gains in November, the U.S. CPRI continued to show strength in December (1.2%). Chemical production increased in all regions, with the West Coast and Northeast gaining the most. The U.S. CPRI was 3.1% higher than a year ago.
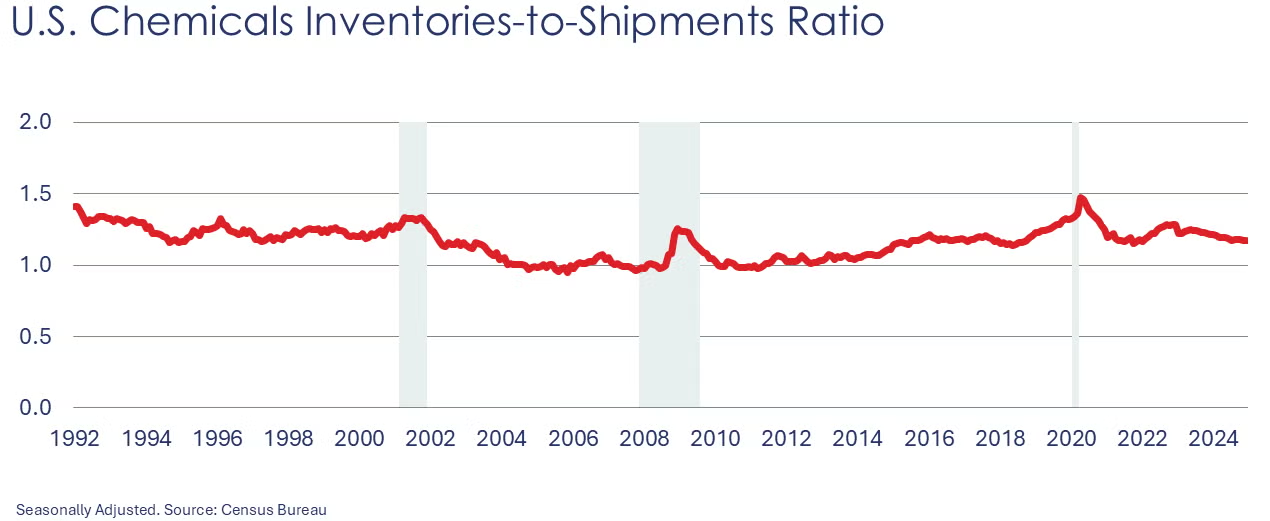
Chemical shipments were 0.1% lower in December. Shipments of agricultural chemicals and coatings and adhesives declined while all other chemicals rose slightly. Chemical inventories eased slightly to a level down by 0.2%. Inventories of agricultural chemicals and coatings and adhesives were drawn down while inventories of other chemicals were essentially unchanged. The inventories-to-sales ratio remained at 1.17 in December. A year ago, the ratio was 1.22. Shipments were up 3.6% Y/Y while inventories were lower by 0.2% Y/Y.
Chemical industry jobs rose 0.2% in December to 550,600, a level up 0.8% Y/Y. Employment in plastic resin manufacturing eased, however, off 0.2% to 61,100, a level 0.5% lower than last December. (Note that data at the detailed industry level are lagged one month behind the headline jobs report.)
In December, combined chemical and pharmaceutical jobs edged higher, up 0.1% to 902,300. Gains in the number of production workers continued to more than offset a decline in supervisory & non-production workers. Average hourly wages rose at a 3.2% Y/Y rate. The average workweek was 18 minutes lower (41.2 hours). Despite the gain in production workers, this suggests that the labor input into the chemicals & pharmaceuticals industry fell – in contrast with the ISM Manufacturing PMI® report that suggested chemical employment was higher in January.
Note On the Color Codes
Banner colors reflect an assessment of the current conditions in the overall economy and the business chemistry of chemistry. For the overall economy we keep a running tab of 20 indicators. The banner color for the macroeconomic section is determined as follows:
Green – 13 or more positives
Yellow – between 8 and 12 positives
Red – 7 or fewer positives
There are fewer indicators available for the chemical industry. Our assessment on banner color largely relies upon how chemical industry production has changed over the most recent three months.
For More Information
ACC members can access additional data, economic analyses, presentations, outlooks, and weekly economic updates through ACCexchange: https://accexchange.sharepoint.com/Economics/SitePages/Home.aspx
In addition to this weekly report, ACC offers numerous other economic data that cover worldwide production, trade, shipments, inventories, price indices, energy, employment, investment, R&D, EH&S, financial performance measures, macroeconomic data, plus much more. To order, visit http://store.americanchemistry.com/.
Every effort has been made in the preparation of this weekly report to provide the best available information and analysis. However, neither the American Chemistry Council, nor any of its employees, agents or other assigns makes any warranty, expressed or implied, or assumes any liability or responsibility for any use, or the results of such use, of any information or data disclosed in this material.
Contact us at ACC_EconomicsDepartment@americanchemistry.com.

