MACROECONOMY & END-USE MARKETS
Running tab of macro indicators: 8 out of 20
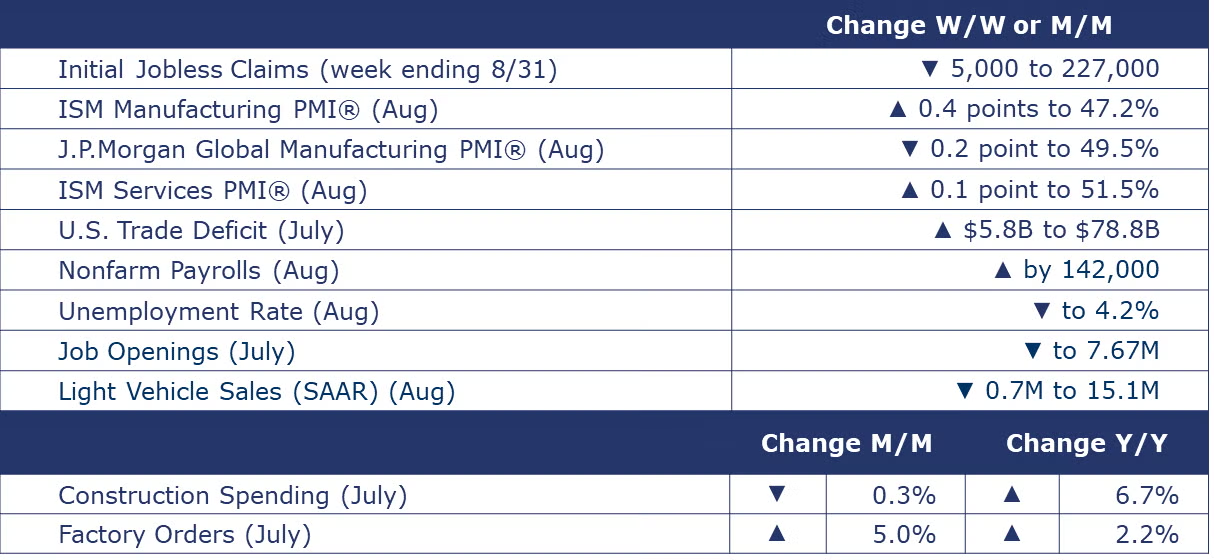
The number of new jobless claims fell by 5,000 to 227,000 during the week ending August 31. Continuing claims fell by 22,000 to 1.838 million, and the insured unemployment rate for the week ending August 24 was unchanged at 1.2%.
Nonfarm payroll employment rose by 142,000 in August, and the unemployment rate nudged down to 4.2%. Job gains occurred in construction and healthcare. Employment edged down in manufacturing. In August, average hourly earnings for all employees on private nonfarm payrolls increased by 14 cents, or 0.4%, to $35.21. Over the past 12 months, average hourly earnings have increased by 3.8%. The average workweek for all employees edged up by 0.1 hour to 34.3 hours in August. In manufacturing, the average workweek edged up by 0.1 hour to 40.0 hours, and overtime edged up by 0.1 hour to 3.0 hours. The average workweek for production and nonsupervisory employees in manufacturing edged up by 0.1 hour to 40.7 hours.
The number of job openings eased slightly to 7.7 million over July and both the number of hires and total separations were little changed at 5.5 million and 5.4 million, respectively. Within separations, quits (3.3 million) and layoffs and discharges (1.8 million) changed little. The number of job openings increased in durable goods manufacturing (+30,000).
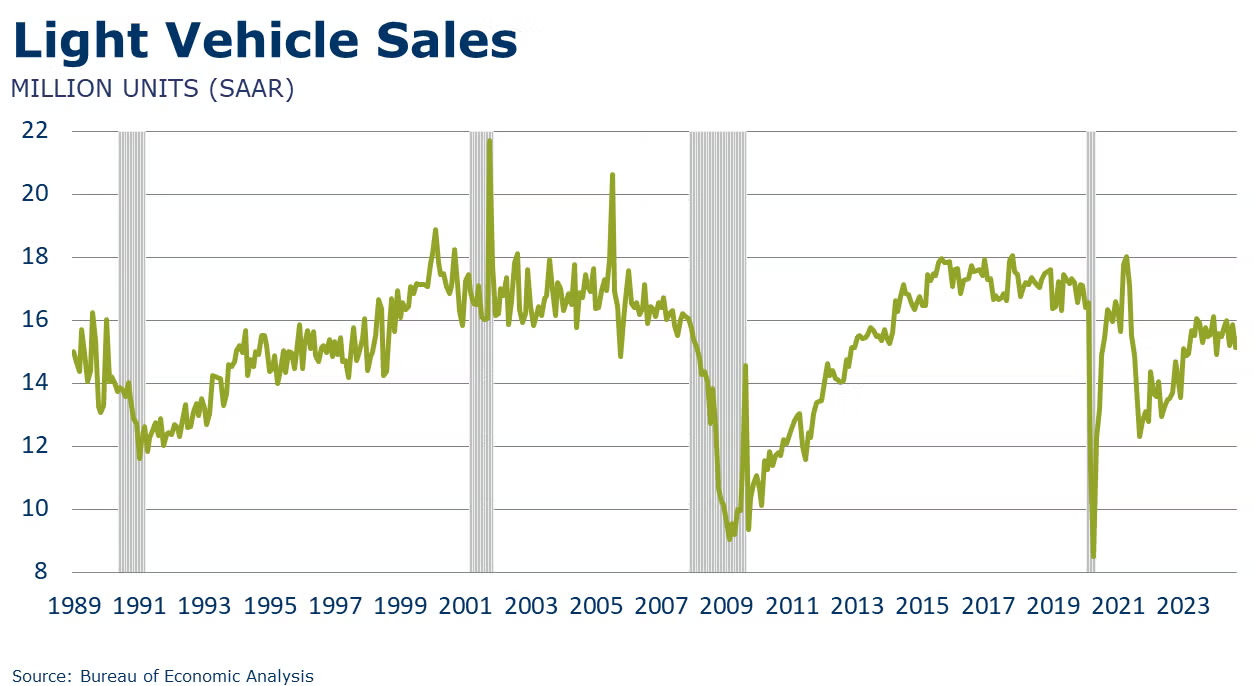
Light vehicle sales dipped back down to 15.1 million units (SAAR) in August, following a gain in July. August sales were at their lowest since January.
Headline factory orders rose 5.0% in July, following a 3.3% decline in June. The gain reflects increased orders for civilian aircraft. Orders for core business goods (nondefense capital goods excluding aircraft) were roughly steady, declining by just 0.1%. Unfilled orders (a measure of the manufacturing pipeline) rose by 0.2%, following a 1.4% in June. Manufacturers’ shipments rose 0.9% and inventories were essentially flat. The inventories-to-shipments ratio edged slightly lower to 1.45. A year ago, the ratio was 1.48.
Construction spending fell by more than expected in July, down by 0.3%. Spending on privately funded residential and nonresidential projects were both lower while spending on publicly-funded projects edged slightly higher. Spending on private single-family projects continued to move lower. In private nonresidential, manufacturing and office construction were flat with declines across most other segments. Overall construction spending was up 6.7% Y/Y.
The ISM Services PMI® rose 0.1 point to 51.5% in August. Over the 50-mark, the reading for July indicates expansion in economic activity in the US services sector. It was the 48th time in 50 months that services grew. Business activity/production grew (though slower), new orders rose, employment rose, and supplier deliveries were faster.
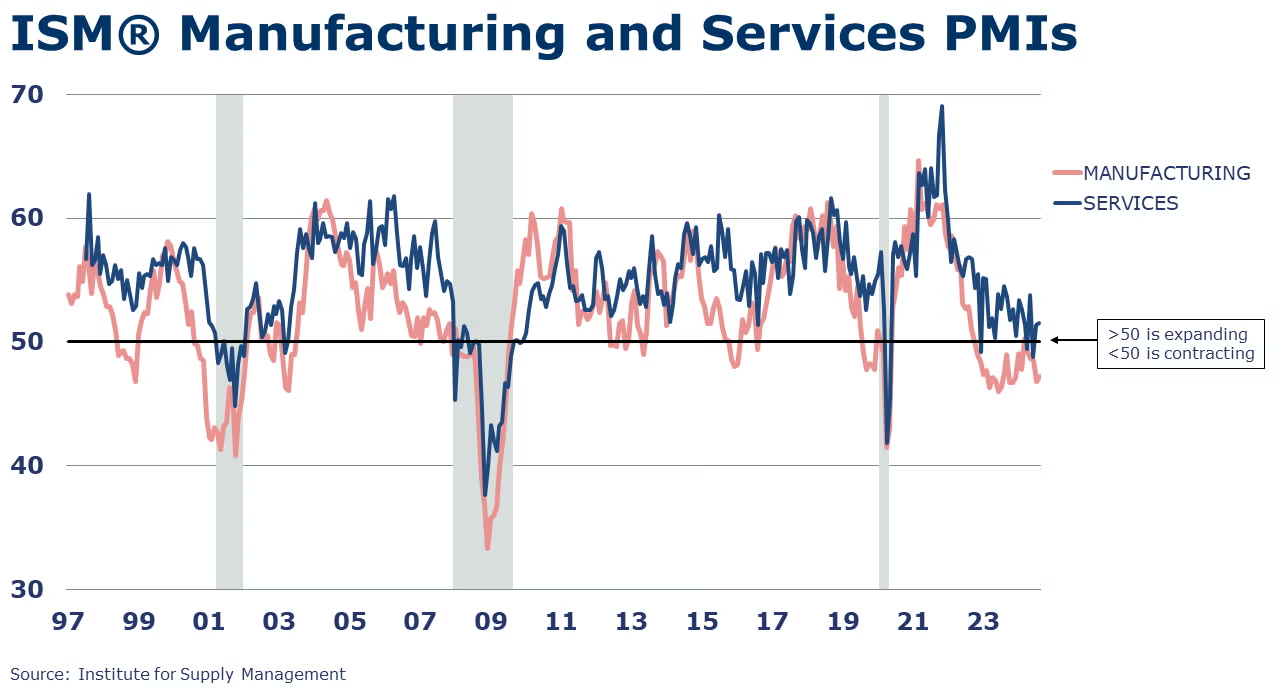
The ISM Manufacturing PMI® rose by 0.4 percentage points to 47.2% in August. A reading below 50 indicates a contraction in manufacturing activity, and August marked the 21st month in the past 22 that the index has been below 50. Production, new orders, employment export orders, and imports all contracted and it was the lowest reading for new orders in more than a year. Supplier deliveries were marginally slower. Inventories expanded in August while customers’ inventories continued to be assessed as “too low”.
Looking abroad, the JP Morgan Global Manufacturing PMI came in at an eight-month low and under the 50% threshold for the second time this year. Global manufacturing output, new orders, and employment all declined in August. New export orders declined for a third month. Of 31 nations for which PMI data were available, 18 registered deteriorations in manufacturing activity. Within segments, output contracted in intermediate and investment goods while consumer goods continued to expand modestly.
The U.S. trade deficit in goods and services expanded by 7.9% to $78.8 billion in July as exports rose 0.5% and imports rose 2.1%. Goods exports rose over July as a gain in semiconductor exports offset declines in other categories including auto and auto parts, and consumer goods. Goods imports rose, driven by increased exports of capital goods including computer accessories.
FED BEIGE BOOK
- Economic activity grew slightly in three Districts, while the number of Districts that reported flat or declining activity rose from five in the prior period to nine in the current period.
- Employment levels were steady overall, though there were isolated reports that firms filled only necessary positions, reduced hours and shifts, or lowered overall employment levels through attrition. Still, reports of layoffs remained rare.
- On balance, wage growth was modest, while increases in nonlabor input costs and selling prices ranged from slight to moderate.
- Consumer spending ticked down in most Districts, having generally held steady during the prior reporting period.
- Auto sales continued to vary by District, with some noting increases in sales and others reporting slowing sales because of elevated interest rates and high vehicle prices.
- Manufacturing activity declined in most Districts, and two Districts noted that these declines were part of ongoing contractions in the sector.
- Residential construction and real estate activity were mixed, though most Districts' reports indicated softer home sales.
- Reports on commercial construction and real estate activity were mixed.
- District contacts generally expected economic activity to remain stable or to improve somewhat in the coming months, though contacts in three Districts anticipated slight declines.
ENERGY
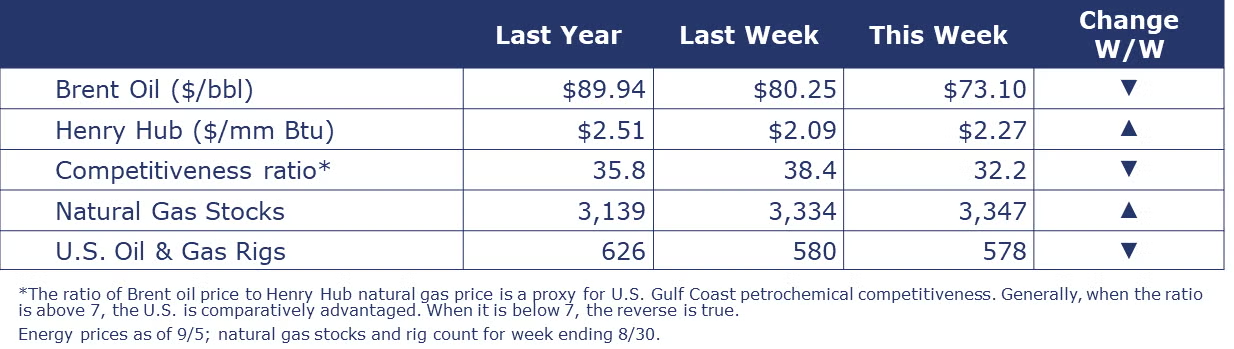
Oil prices hit their lowest point this year this week on disappointing economic news from China and signs of a slowing US economy. At the same time, supplies are expected to increase from a return of Libyan crude and possibly additional supplies from OPEC related to the unwinding of production cuts in October. U.S. natural gas prices were higher than a week ago but remain comparatively low as storage levels remain well above average for this time of the year. The combined oil and gas rig count fell by two to 578 during the week ending 30 August.
CHEMICALS
Indicators for the business of chemistry suggest a yellow banner.
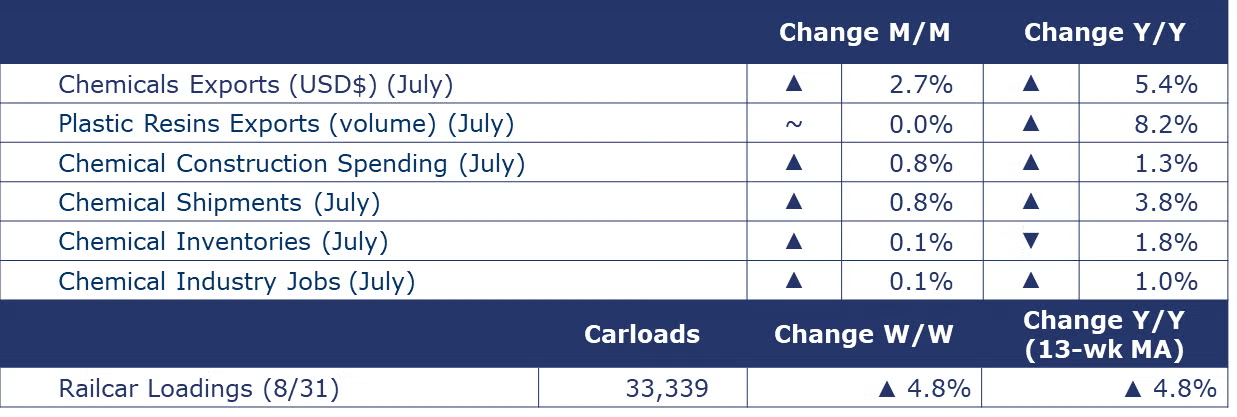
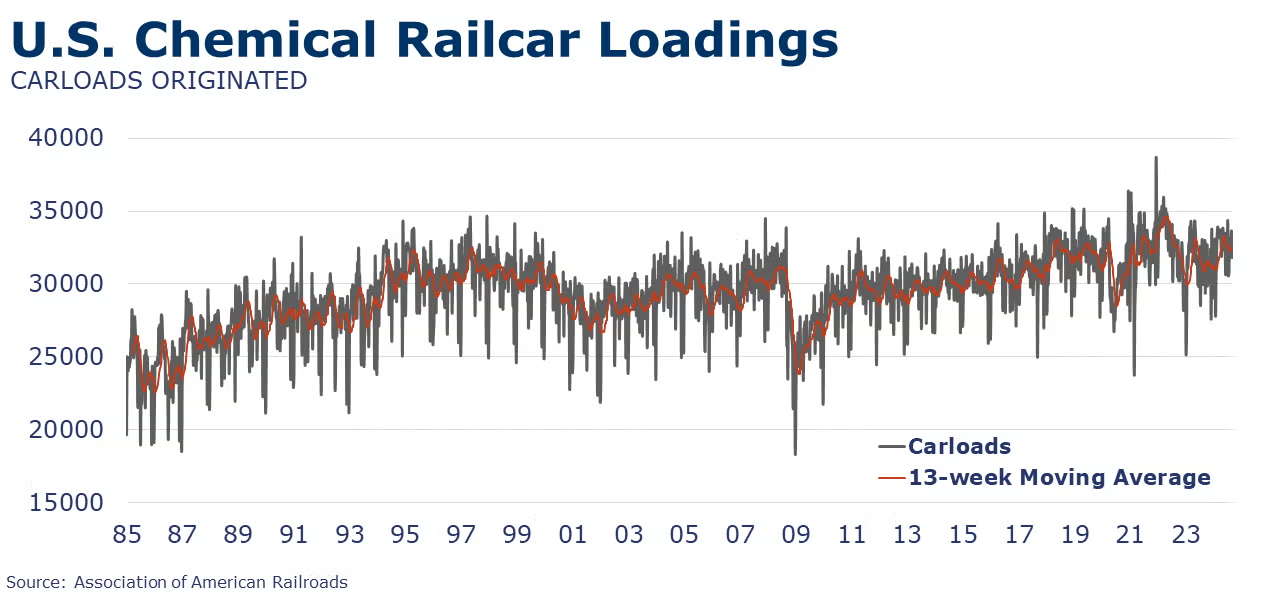
According to data released by the Association of American Railroads, chemical railcar loadings were up to 33,339 for the week ending August 31. Loadings were up 4.8% Y/Y (13-week MA), up (4.2%) YTD/YTD and have been on the rise for 9 of the last 13 weeks.
Within the details of the ISM Manufacturing PMI® report, the chemical industry was reported to have contracted in August. Production, new orders, employment, order backlogs, and new export orders were lower. Chemical import volumes were reported to be higher, however. The chemical industry was among five industries reporting faster supplier deliveries, an indicator of “slack” in the supply chain. Manufacturing inventories were higher and raw material prices were reported to be higher. One chemical industry respondent noted, “A noticeable slowdown in business activity. Staffing and production rationalization has been triggered. Previous optimism about future growth has been dashed.”
The Fed Beige Book commented, “Refiners and petrochemical processors noted that carbon capture and storage projects continued to grow moderately.”
Chemical construction spending rose by 0.8% to $36.3 billion in July, a level 1.3% higher than a year ago.
U.S. chemical exports were up 2.7% in July reflecting gains in all categories except coatings and other specialties. Chemical imports rose by 2.5% as declines in agricultural chemicals, inorganics, and coatings were offset by gains in other chemicals categories. The U.S. chemicals trade surplus rose to $2.3 billion in July and is $15.0 billion YTD. Compared to the same month last year, exports were up 5.4% Y/Y and imports were up 5.8% Y/Y.
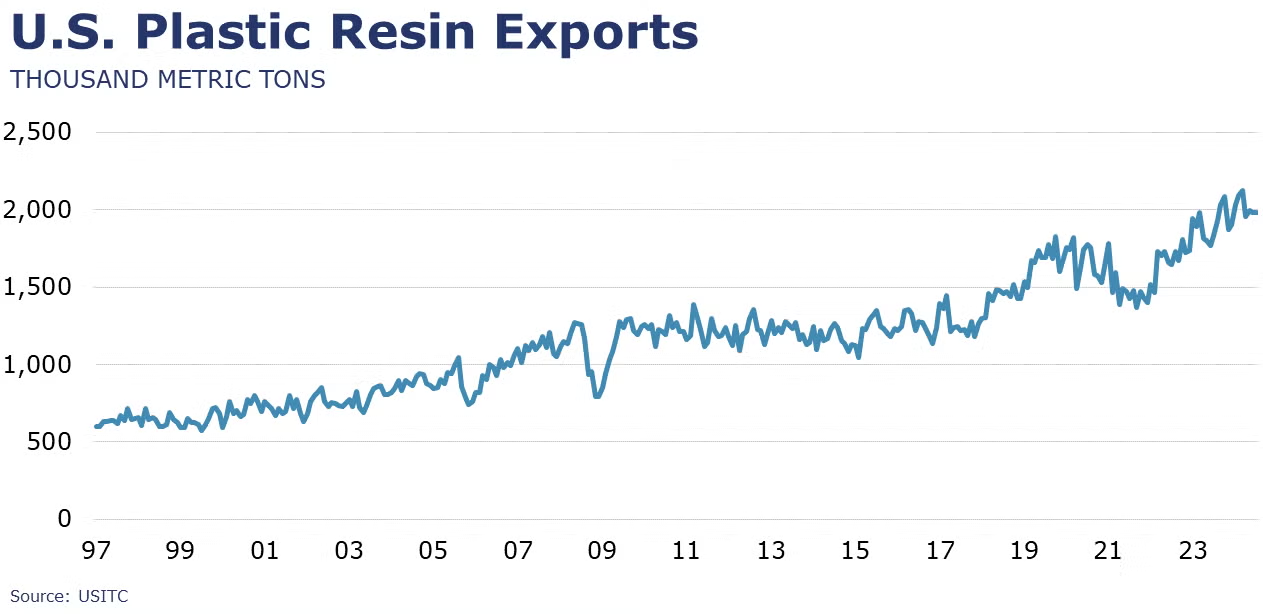
U.S. plastic resins exports were up by 2.2% in July to a level up 14.9% Y/Y on a USD$ value basis. On a volume comparison, at 2.0 million metric tons exported in July, plastic resins exports were unchanged from June and up 8.2% Y/Y.
Chemical shipments rose 0.8% in July, the sixth consecutive monthly gain. Gains in shipments of agricultural and other chemicals offset a decline in shipments of coatings & adhesives. Chemical shipments were up 3.8% Y/Y. Chemical inventories were stable as modest gains in agricultural chemicals and coatings & adhesives were partially offset by a small decline in other chemicals. Inventories were off 1.8% Y/Y. The inventories-to-sales ratio remained at 1.18, which was lower than last July’s ratio of 1.24.
Jobs in chemicals (ex-pharma) rose by 600 in July to 557,000. There were 2,500 additional production worker jobs added. Chemical industry employment levels were up 1.0% Y/Y.
Note On the Color Codes
Banner colors reflect an assessment of the current conditions in the overall economy and the business chemistry of chemistry. For the overall economy we keep a running tab of 20 indicators. The banner color for the macroeconomic section is determined as follows:
Green – 13 or more positives
Yellow – between 8 and 12 positives
Red – 7 or fewer positives
There are fewer indicators available for the chemical industry. Our assessment on banner color largely relies upon how chemical industry production has changed over the most recent three months.
For More Information
ACC members can access additional data, economic analyses, presentations, outlooks, and weekly economic updates through ACCexchange.
In addition to this weekly report, ACC offers numerous other economic data that cover worldwide production, trade, shipments, inventories, price indices, energy, employment, investment, R&D, EH&S, financial performance measures, macroeconomic data, plus much more. To order, visit http://store.americanchemistry.com/.
Every effort has been made in the preparation of this weekly report to provide the best available information and analysis. However, neither the American Chemistry Council, nor any of its employees, agents or other assigns makes any warranty, expressed or implied, or assumes any liability or responsibility for any use, or the results of such use, of any information or data disclosed in this material.
Contact us at ACC_EconomicsDepartment@americanchemistry.com.


