Running tab of macro indicators: 11 out of 20
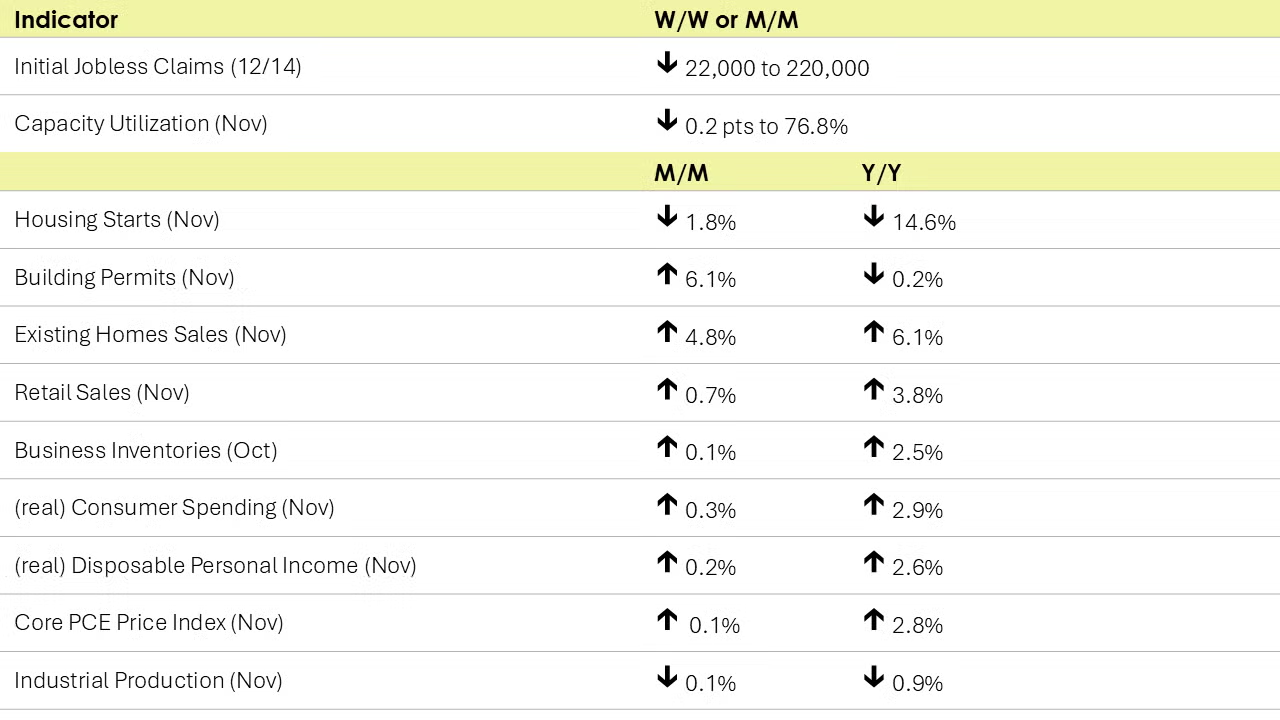
As expected, the FOMC cut the benchmark federal funds rate by 25 basis points to a 4.25-4.5% range. The cut brings the cumulative rate cuts since September to 100 basis points. Looking ahead, the Fed signaled a slower pace of rate cuts. While inflation has come down from four-decade highs in 2022, recent data suggest progress has stalled. The Fed’s target core PCE price index has held steady the last two months at 2.8% Y/Y, up from Q3.
The number of new jobless claims fell by 22,000 to 220,000 during the week ending December 14th. Continuing claims fell by 5,000 to 1.874 million, and the insured unemployment rate for the week ending December 7th was unchanged at 1.2%.
Consumer spending advanced in November with real (inflation-adjusted spending) up by 0.3%. The gain was led by strong spending on durable goods (up 1.8%). Spending on nondurable goods and services also rose at a smaller pace. Spending continues to be fueled by gains in real disposable personal income which rose 0.2%. Real consumer spending was up by 2.9% Y/Y while spending was up by 2.6% Y/Y. The personal savings rate came in at 4.4% in November, in line with recent gains.
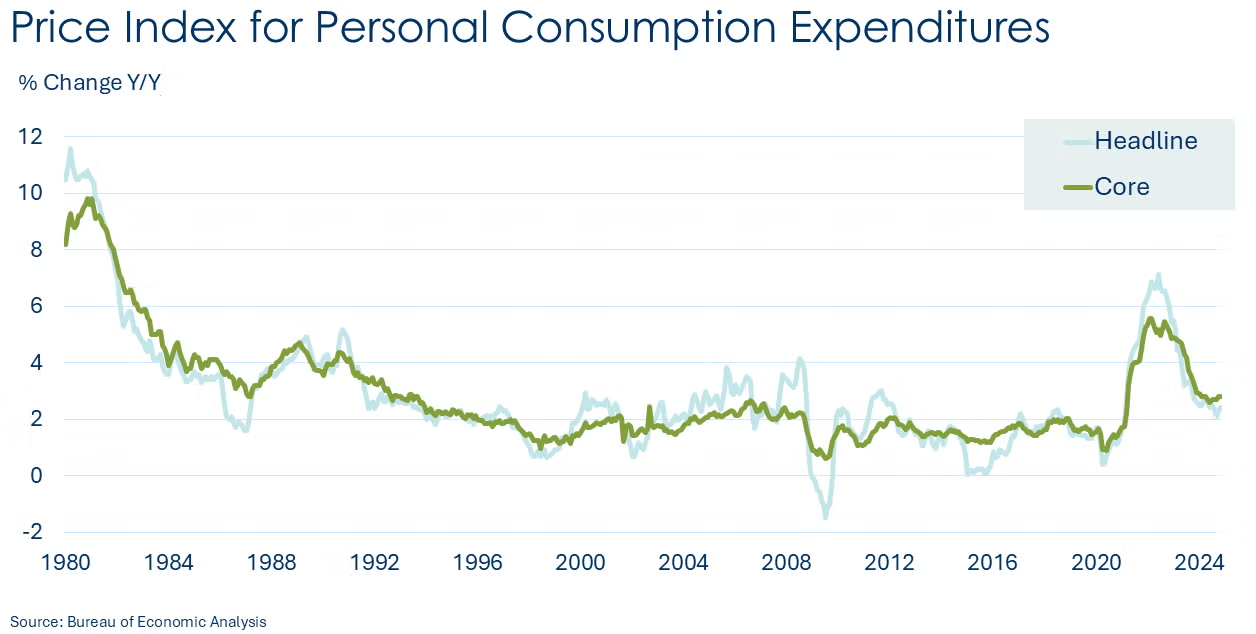
The price index for personal consumption expenditures (so-called PCE price index) rose in November. The headline index was up 2.4% Y/Y, up from both October and September. The closely watched core PCE price index (excluding food and energy) rose at a 2.8% Y/Y pace, steady compared to October, but was up from the previous three months, confirming that progress on inflation appears to have stalled.
Headline retail and food service sales rose 0.7% in November, a faster gain than in October. The largest gains in sales were at motor vehicle & parts dealers. Retail and food service sales were up 3.8% Y/Y.
Combined business inventories edged slightly higher in October (up 0.1%). There were gains in retail and wholesalers’ inventories and a decline in manufacturers’ inventories. Business sales were flat as gains in retail were offset by declines in manufacturers and wholesalers. Business inventories were up 2.5% Y/Y while sales were higher by 3.9% Y/Y. The inventories-to-sales ratio remained steady from September at 1.37. A year ago, the ratio was 1.36.
Existing home sales jumped in November, up 4.8% with stronger sales across much of the country. Mortgage rates were lower in September and October following the Fed’s initial rate cut. Existing home sales are recorded when transactions close on contracts written weeks earlier. Mortgage rates have since risen, despite further cuts in the federal funds rate. Compared to a year ago, sales were up 6.1%. Inventories were up 17.7% from a year ago and represented a 3.8-month supply at the current sales pace. This was down from 4.2 months in October, but higher than the 3.5 months of inventory a year ago. The median existing-home price was up 4.7% Y/Y to $406,100.
Housing starts fell for a third straight month, down by 1.8% in November. The decline was led by lower multi-family starts. Chemistry-intensive single-family starts rose 6.4%. Single-family starts were higher in the South, but lower in the Northeast, Midwest and West. Forward-looking building permits rose 6.1%, but single-family permits edged down by 0.1%. Housing starts were down 14.6% Y/Y while building permits were off 0.2%.
Home builder confidence held steady at 46 in December. Across the three components, current sales conditions held steady, sales conditions six months ahead dipped, and buyer traffic rose (hitting its highest reading since April 2022). The index remains below 50, a threshold where a majority of homebuilders are confident about the current and near-term outlook for housing. According to the NAHB, “While builders are expressing concerns that high interest rates, elevated construction costs and a lack of buildable lots continue to act as headwinds, they are also anticipating future regulatory relief in the aftermath of the election.”
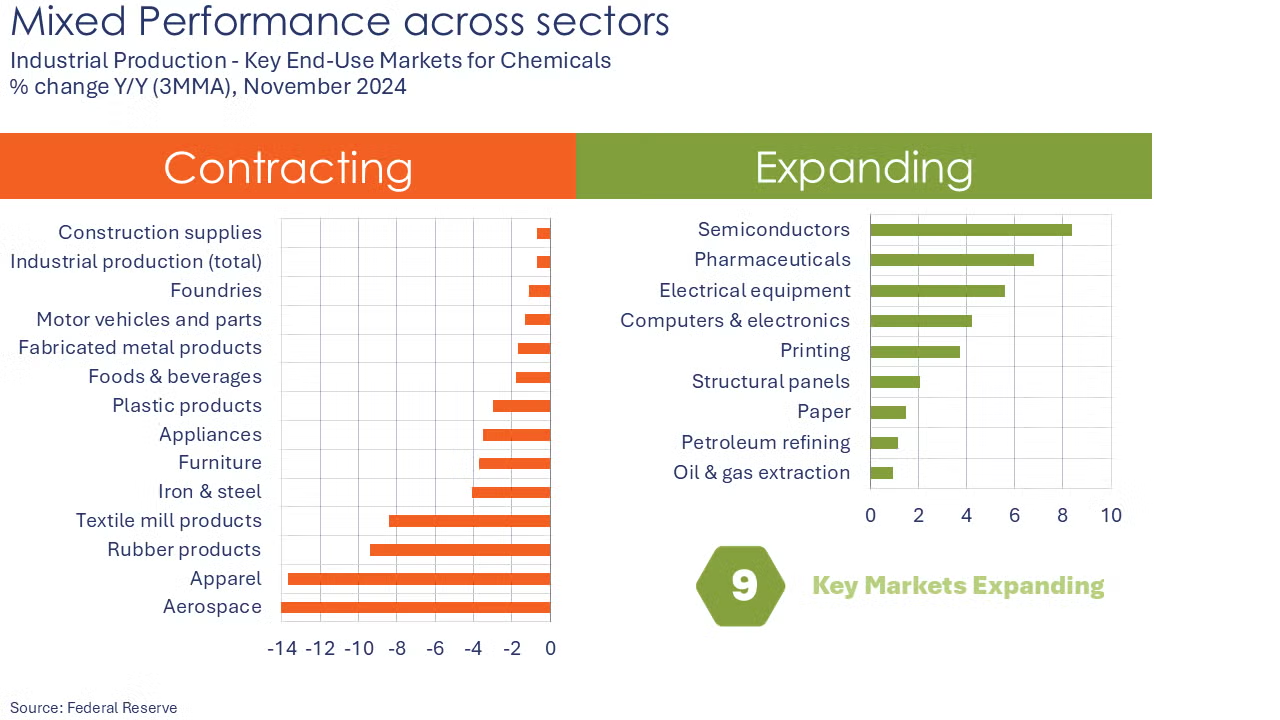
Overall industrial production eased for a third consecutive month in November, off by 0.1%. Lower output in mining and utilizes offset gains in manufacturing. Manufacturing production rose 0.2% following two months of declines. Within manufacturing, the highest gains were in motor vehicles, machinery, and furniture. Aerospace output continued to drift lower despite the end of the Boeing strike at the beginning of the month. Compared to a year ago, manufacturing output was lower by 1.0% while overall industrial production was off 0.9% Y/Y. Capacity utilization moved lower by 0.2 percentage points to 76.8%, well below the 78.4% rate last November.
Business activity held steady in New York State in December, according to the Empire State Manufacturing Survey. Following a burst of activity in November, the general business conditions index moved to just above neutral, falling 31.0 points to +0.2. New orders and shipments continued to expand more slowly but unfilled orders continued to contract. Inventories rose and employment slipped. Looking ahead, manufacturers were a little less optimistic about business conditions six months from now.
In the Philadelphia Federal Reserve district, manufacturing continued to decline in December. Its headline general business index fell 10.9 points to -16.4. Shipments, new orders, and inventories contracted, but unfilled orders and employment expanded. Looking ahead, manufacturers remained optimistic, but less so compared to November’s reading.
The Conference Board’s Leading Economic Index® (LEI) rose for the first time in two years in November, up by 0.3%. Over the past six months, the LEI declined by 1.6%, slightly less than the 1.9% decline over the previous six-month period (November 2023 to May 2024). The improvement in the LEI was driven by the rebound in building permits, continued support from equities, improvement in average hours worked in manufacturing, and fewer initial unemployment claims.
In its third and final estimate of Q3 GDP, the Bureau of Economic Analysis reported the U.S. economy grew at a 3.1% seasonally adjusted annual rate (SAAR). This was up from its previous estimate of 2.8% and reflects more complete source data. It also represents a slight acceleration from Q2 when the economy grew at a 3.0% pace. The largest contributions to Q3 growth were from personal consumption expenditures, business spending on equipment, and government spending.

Oil prices eased slightly from a week ago following the more hawkish tone of this week’s FOMC announcement. U.S. natural gas prices were higher on colder January forecasts. With a strong 125 BCF draw last week, inventories are once again within the five-year historical range. The combined oil and gas rig count rose by one to 585, the second consecutive weekly gain.
Indicators for the business of chemistry suggest a yellow banner.

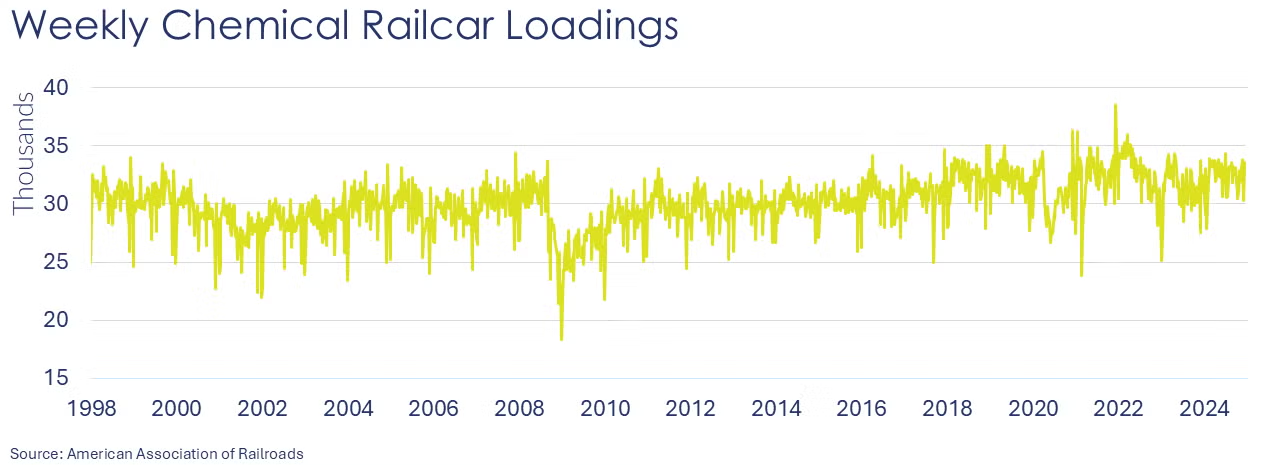
According to data released by the Association of American Railroads, chemical railcar loadings were down to 32,862 for the week ending December 14th. Loadings were up 3.6% Y/Y (13-week MA), up (4.1%) YTD/YTD and have been on the rise for six of the last 13 weeks.
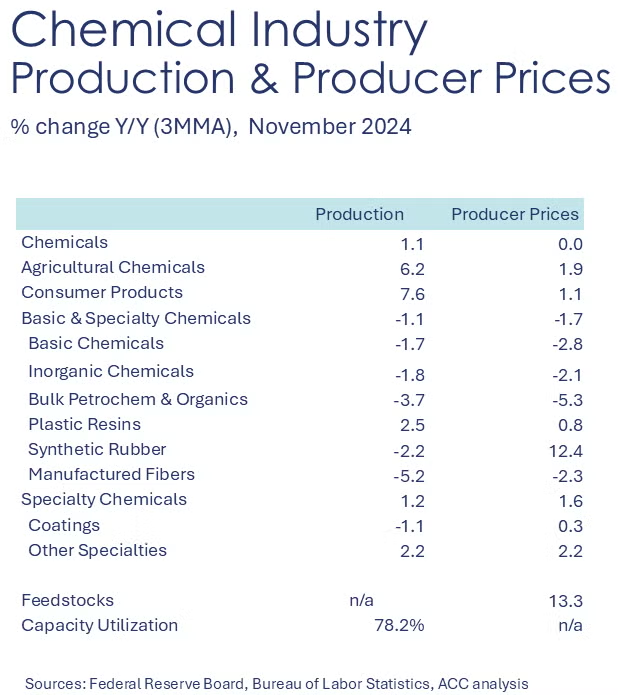
Chemical production edged higher in November, the second consecutive gain. Output was higher in organic chemicals, plastic resins, coatings and other specialty chemicals. These gains were offset by lower production of inorganic chemicals, synthetic rubber, manufactured fibers, fertilizers, and crop protection chemicals. Compared to last November, chemical production was up 2.2%. Chemical capacity utilization held steady in November at 78.2% (compared to October) but was up from 77.4% a year ago.
Note On the Color Codes
Banner colors reflect an assessment of the current conditions in the overall economy and the business chemistry of chemistry. For the overall economy we keep a running tab of 20 indicators. The banner color for the macroeconomic section is determined as follows:
Green – 13 or more positives
Yellow – between 8 and 12 positives
Red – 7 or fewer positives
There are fewer indicators available for the chemical industry. Our assessment on banner color largely relies upon how chemical industry production has changed over the most recent three months.
For More Information
ACC members can access additional data, economic analyses, presentations, outlooks, and weekly economic updates through ACCexchange: https://accexchange.sharepoint.com/Economics/SitePages/Home.aspx
In addition to this weekly report, ACC offers numerous other economic data that cover worldwide production, trade, shipments, inventories, price indices, energy, employment, investment, R&D, EH&S, financial performance measures, macroeconomic data, plus much more. To order, visit http://store.americanchemistry.com/.
Every effort has been made in the preparation of this weekly report to provide the best available information and analysis. However, neither the American Chemistry Council, nor any of its employees, agents or other assigns makes any warranty, expressed or implied, or assumes any liability or responsibility for any use, or the results of such use, of any information or data disclosed in this material.
Contact us at ACC_EconomicsDepartment@americanchemistry.com.


