MACROECONOMY & END-USE MARKETS
Running tab of macro indicators: 10 out of 20
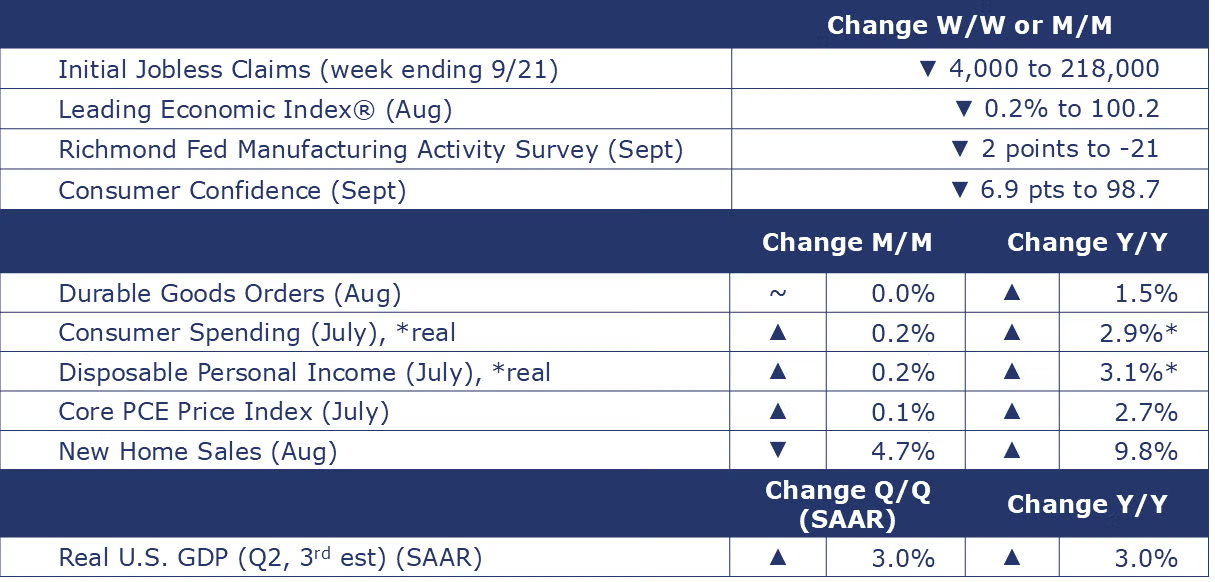
The number of new jobless claims fell by 4,000 to 218,000 during the week ending September 21. Continuing claims increased by 13,000 to 1.834 million, and the insured unemployment rate for the week ending September 14 was unchanged at 1.2%.
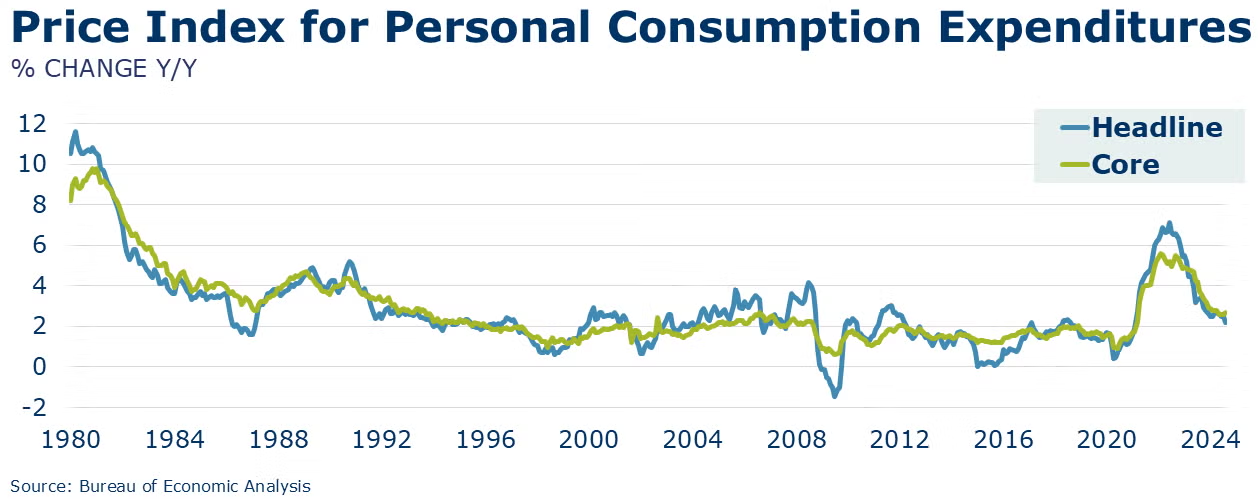
Consumer spending continued to expand in August, up 0.2%. The gain was driven entirely by higher spending on services. Consumer outlays on both durable and nondurable goods fell. Disposable personal income (the ability to spend) also rose by 0.2%. The aggregate savings rate edged lower to 4.8%. Compared to a year ago, inflation-adjusted consumer spending was up 2.9% Y/Y while real disposable income was up by 3.1% Y/Y. Income and spending remain relatively balanced. The headline price index for personal consumption expenditures was up 2.2% Y/Y, the smallest annual gain since early-2021. Growth in the Fed’s preferred inflation measure, the core PCE price index (excluding the volatile food and energy components) ticked higher to 2.7% in August compared to 2.6% in July.
Consumers were more pessimistic in September, as the Conference Board’s Consumer Confidence Index® fell sharply, down 6.9 points to 98.7, the largest decline in three years. Consumers’ assessment of current business conditions turned negative, and they were more pessimistic about future labor market conditions. Consumer buying plans for large appliances were mixed and plans to buy a smartphone or laptop/PC in the next six months eased. Purchasing plans for homes and new cars improved slightly.
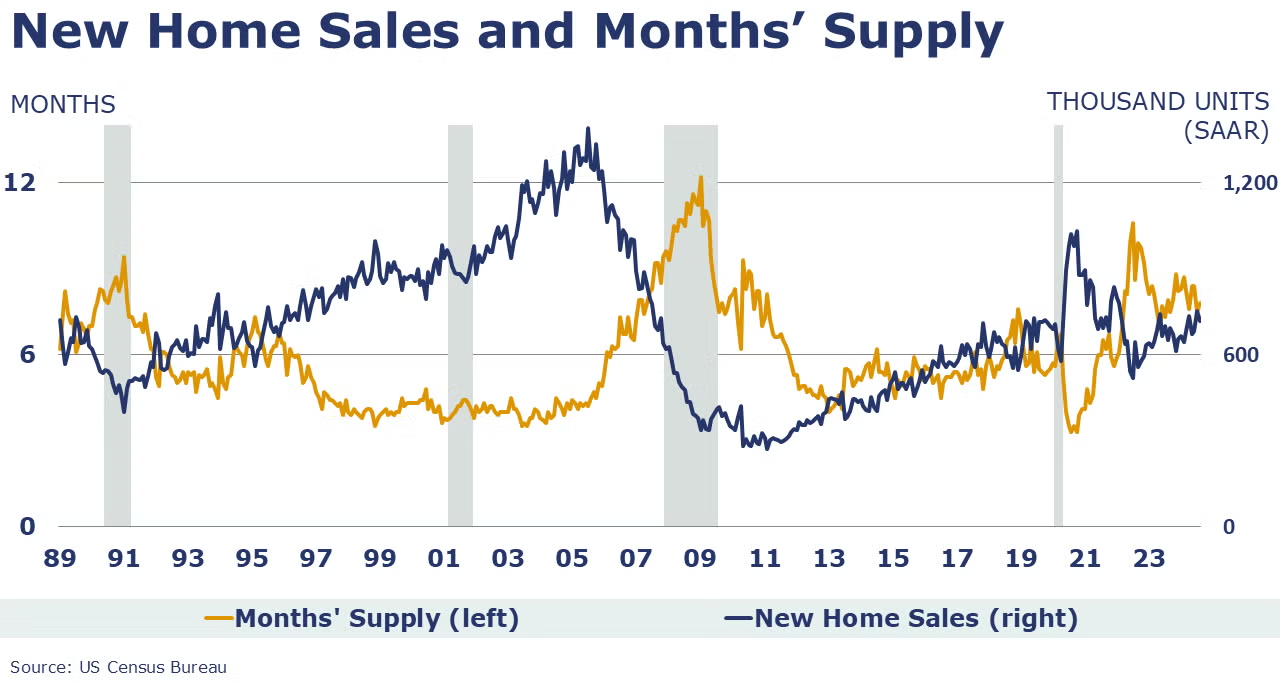
Sales of new single-family homes were at a seasonally adjusted annual rate (SAAR) of 716,000 in August. That pace is down 4.7% from July but up 9.8% compared to August 2023. Sales declined in all regions except the South. Inventories of unsold homes at the end of August were 6.8% higher compared to July, but 1.3% lower than levels a year ago. Months’ supply (at the current sales pace) rose from 7.3 months in July to 7.8 months in August. At $420,600, the median sales price was 4.6% lower than a year ago.
The Conference Board’s Leading Economic Index® continued to slide in August, down by 0.2% to 100.2. Over the past six months, the index has fallen by 2.3%, slower than the six-month decline recorded in July. New orders, which fell to its lowest level in more than a year in July, led the decline. There were also negative contributions from the interest rate spread, poor consumer expectations for future business conditions, and lower equity prices in August. The Conference Board is projecting slower growth through the end of the year.
In its third estimate for the quarter, BEA estimated that real GDP rose at a 3.0% seasonally adjusted annual rate in Q2. This is unchanged from the second estimate. Compared to the same quarter last year, GDP was 3.0% higher. Growth in the price index for GDP rose from 2.4% Y/Y in Q1 to 2.6% Y/Y in Q2. Excluding food and energy, the core GDP price index rose from 2.7% Y/Y in Q1 to 2.8% Y/Y in Q2.
Durable goods orders held steady in August following a 9.9% advance in July which was driven by a strong recovery in new orders for civilian aircraft. Core business orders (nondefense capital goods excluding aircraft) rose 0.2% in August following a 0.2% decline in July. Over August, orders rose in primary metals, fabricated metal products, machinery, computers and electronic products, electrical equipment, appliances, and components, autos and parts, defense aircraft and parts, and in other durable goods. These gains were offset by lower civilian aircraft orders. Headline durable orders were down 1.3% YTD/YTD while core business orders were up 0.3%.
SURVEY OF ECONOMIC FORECASTERS
- At the end of Q3, growth in the U.S. economy has slowed.
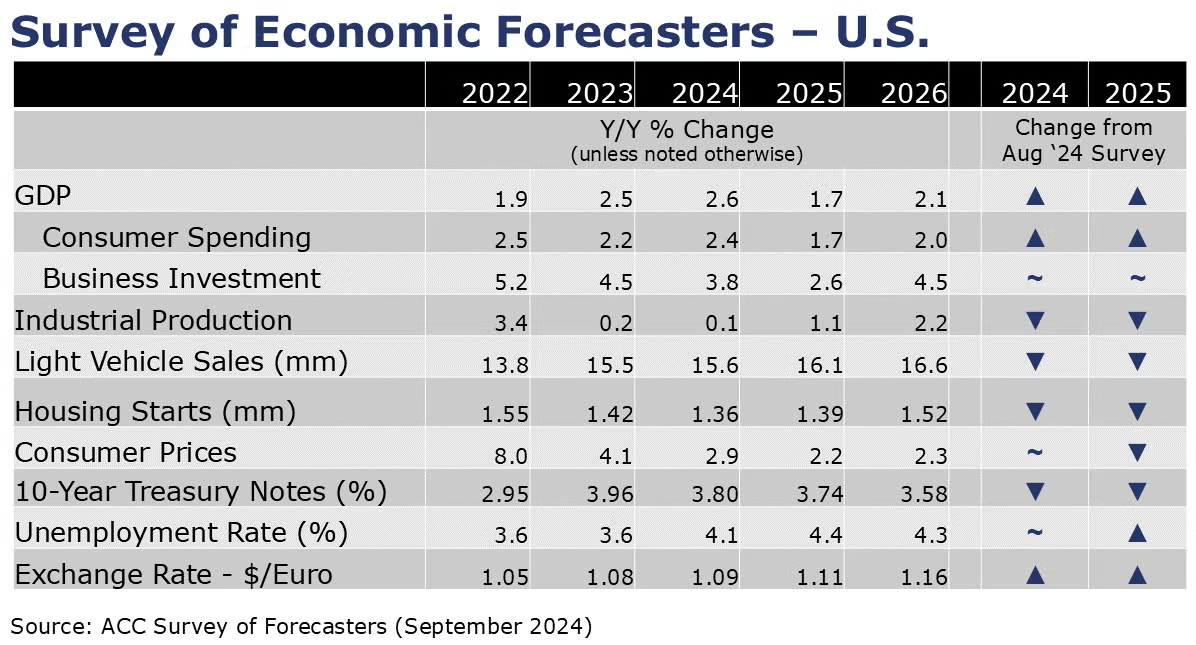
- With a boost from better-than-expected Q2 results, however U.S. GDP is expected to grow by 2.6% in 2024 and by 1.7% in 2025.
- Growth in consumer spending is expected to come in higher than last year at a 2.4% pace in 2024 before easing to a 1.7% gain in 2025.
- Business investment has remained stronger than expected despite higher borrowing costs and is expected to grow by 3.8% in 2024 before slowing to a 2.6% pace in 2025.
- Following a 0.2% gain in 2023, we look for industrial production to grow at a similar pace (0.1%) in 2024 before firming to a 1.1% pace in 2025. Growth is uneven among industries, however.
- Sales of autos and light trucks are expected to grow to 15.6 million in 2024 (still below trend) before rising to a 16.1 million pace in 2025, lower than a month ago.
- Housing expectations were also revised lower. Housing starts are expected to come in at 1.36 million in 2024 before rising to a 1.39 million pace in 2025 as mortgage rates ease next year.
- The unemployment rate is expected to move higher as the labor market rebalances averaging 4.1% in 2024 and 4.4% in 2025.
- Recent data shows more progress on inflation. Growth in consumer prices is expected to slow to a 2.9% pace in 2024 and 2.2% in 2025.
- With a 50-basis point cut to the Federal Funds rate, a cycle of monetary easing has begun. As a result, expectations for 10-year Treasury yields eased for 2024 and 2025.
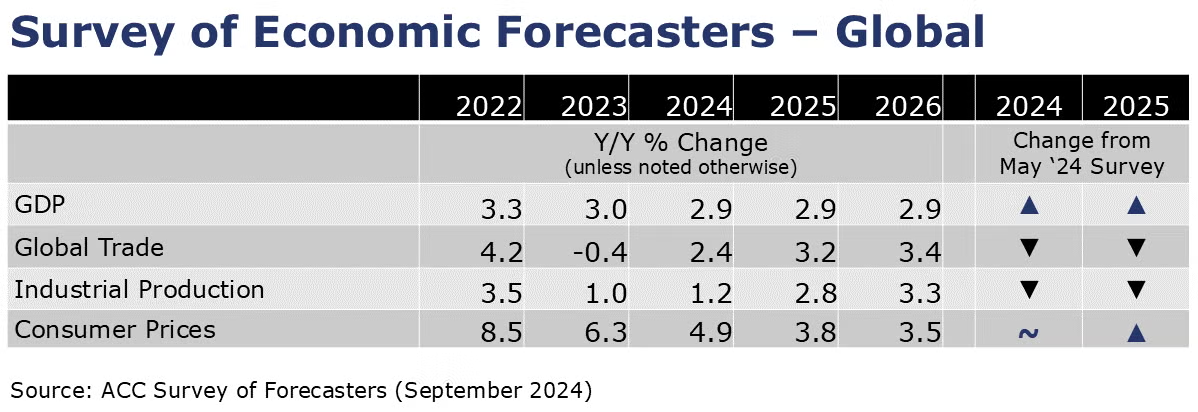
- Global GDP growth was revised up to 2.9% for 2024. The 2025 global growth forecast was also upwardly revised to 2.9%. Global activity is forecast to continue at a 2.9% pace in 2026.
- Global inflation pressures have eased since 2022. Inflation will continue to moderate, advancing at a 4.9% pace this year (2024) and further easing toward an average 3.2% pace over the 2028-2032 period.
- Global manufacturing was weak and lacked momentum through 2023, expanding by about 1% over the year. Growth will return as demand recovers. The industrial sector is forecast to grow 1.2% this year and pick up to a 2.8% pace in 2025.
- Relatively weak demand for manufactured goods was observed throughout the past year in flat or falling new orders – both domestic and export. Muted external demand for industrial goods hampered world trade volumes and trade contracted in 2023. Trade volumes are forecast to recover this year by a downwardly revised 2.4% and by 3.2% in 2025.
ENERGY
- As of Thursday afternoon, 30% of GOM oil production has been shut in and 17% of GOM natural gas production was offline in anticipation of Hurricane Helene.
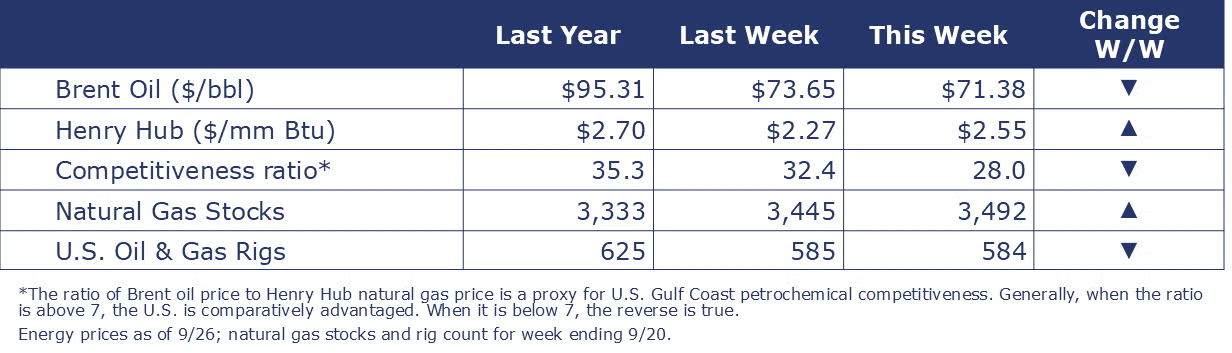
- Oil prices fell on news that KSA plans to abandon its unofficial price target and increase output. In addition, progress was made on an internal Libyan conflict that should allow for the resumption of Libyan oil to the global market.
- While higher than a week ago, U.S. natural gas prices eased from their highest levels since June earlier in the week when it wasn’t yet clear if Hurricane Helene was likely to disrupt GOM gas activity.
- The large buffer in natural gas inventories has slowly diminished over the past several months. Inventories remained 7.1% above the five-year historical average, however.
- The combined oil & gas rig count fell by one to 584.
CHEMICALS
Indicators for the business of chemistry suggest a yellow banner.

According to data released by the Association of American Railroads, chemical railcar loadings were up to 33,139 for the week ending September 21. Loadings were up 5.4% Y/Y (13-week MA), up (4.3%) YTD/YTD and have been on the rise for 8 of the last 13 weeks.

Following a 0.5% gain in July, ACC’s Global Chemical Production Regional Index (Global CPRI) edged up by 0.1% in August. Growth was observed in Asia-Pacific, South America, Africa, and the Middle East. The most significant contributions came from China, where exports remained strong. Germany, Korea, and Taiwan also contributed. While output in all segments grew, the other specialties segment gained the most. Global chemicals production was up 4.4% Y/Y.
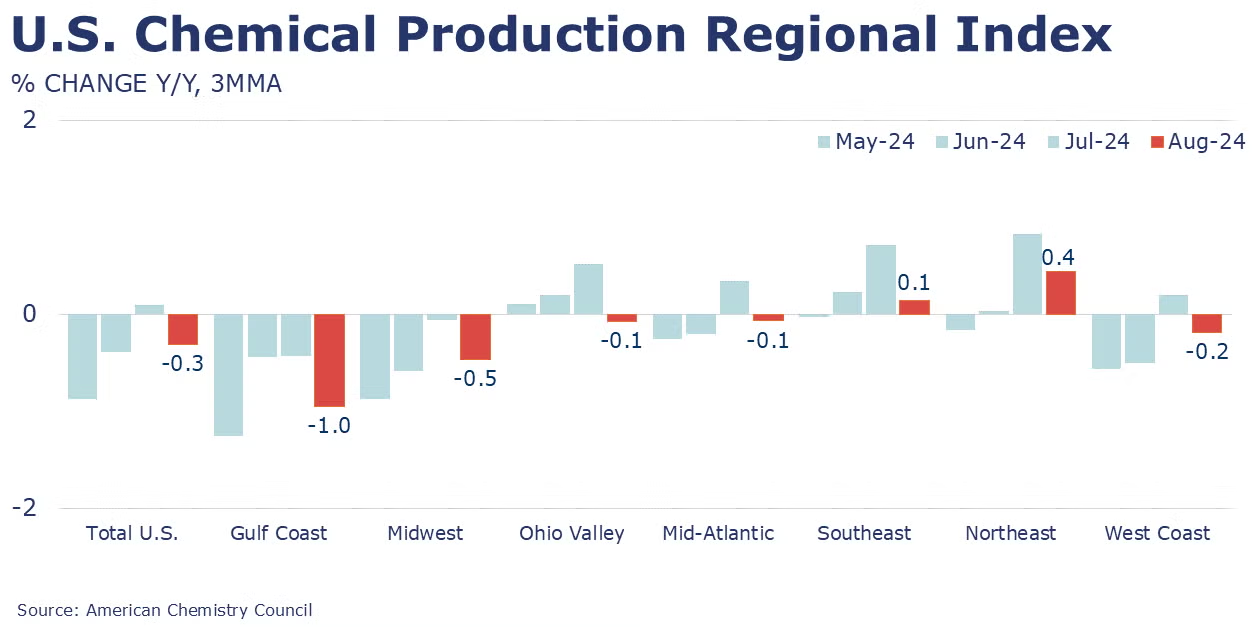
Following a 0.4% gain in July, the U.S. CPRI stalled in August (0%). The U.S. CPRI measures chemical production trends on a three-month moving average (3MMA) to smooth month-to-month volatility. Chemical production declined in all regions except the Gulf region, where production increased. The U.S. CPRI remained off by 0.3% compared to a year ago.
Note On the Color Codes
Banner colors reflect an assessment of the current conditions in the overall economy and the business chemistry of chemistry. For the overall economy we keep a running tab of 20 indicators. The banner color for the macroeconomic section is determined as follows:
Green – 13 or more positives
Yellow – between 8 and 12 positives
Red – 7 or fewer positives
There are fewer indicators available for the chemical industry. Our assessment on banner color largely relies upon how chemical industry production has changed over the most recent three months.
For More Information
ACC members can access additional data, economic analyses, presentations, outlooks, and weekly economic updates through ACCexchange.
In addition to this weekly report, ACC offers numerous other economic data that cover worldwide production, trade, shipments, inventories, price indices, energy, employment, investment, R&D, EH&S, financial performance measures, macroeconomic data, plus much more. To order, visit http://store.americanchemistry.com/.
Every effort has been made in the preparation of this weekly report to provide the best available information and analysis. However, neither the American Chemistry Council, nor any of its employees, agents or other assigns makes any warranty, expressed or implied, or assumes any liability or responsibility for any use, or the results of such use, of any information or data disclosed in this material.
Contact us at ACC_EconomicsDepartment@americanchemistry.com.

