MACROECONOMY & END-USE
Running tab of macro indicators: 12 out of 20
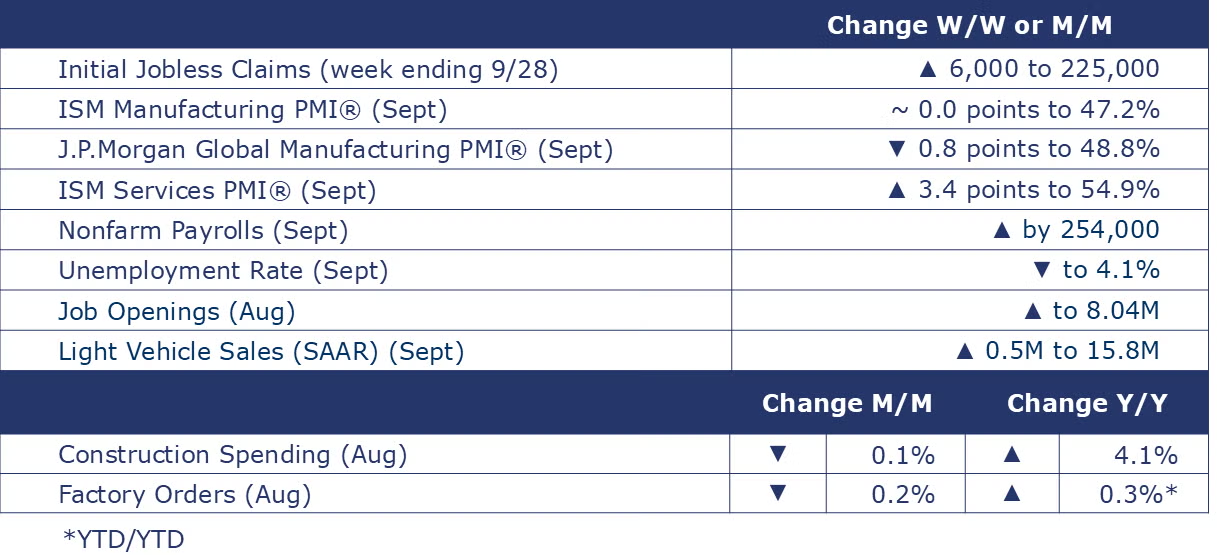
The highly anticipated jobs report showed that the nonfarm payrolls expanded by a higher-than-expected 254,000 in September. August’s gain was revised higher to 159,000. Job gains were broad-based across most major sectors, with services accounting for the lion’s share of job growth. Employment in manufacturing and transportation and warehousing was lower, however. Bellwether temporary help services jobs also continued to fall. Growth in average hourly earnings for all employees edged higher to 4.0% Y/Y, the highest pace since May. The unemployment rate eased to 4.1% in September, down from 4.2% in August. A gain in the labor force was more than offset by higher employment.
The number of new jobless claims rose by 6,000 to 225,000 during the week ending September 28. Continuing claims fell by 1,000 to 1.826 million, and the insured unemployment rate for the week ending September 21 was unchanged at 1.2%.
The number of job openings rose by 329k to 8.0 million in August. Over the month, both the number of hires and total separations were little changed at 5.3 million and 5.0 million, respectively. Within separations, quits (3.1 million) continued to trend down and layoffs and discharges (1.6 million) changed little. The number of job openings decreased in durable goods manufacturing (-11,000).
Construction spending fell by 0.1% in August. Spending on privately funded residential and nonresidential projects were both lower while spending on publicly funded projects was 0.3% higher. Spending on both private single-family and multifamily projects declined. In private nonresidential, manufacturing spending rose. Overall construction spending was up 4.1% Y/Y.
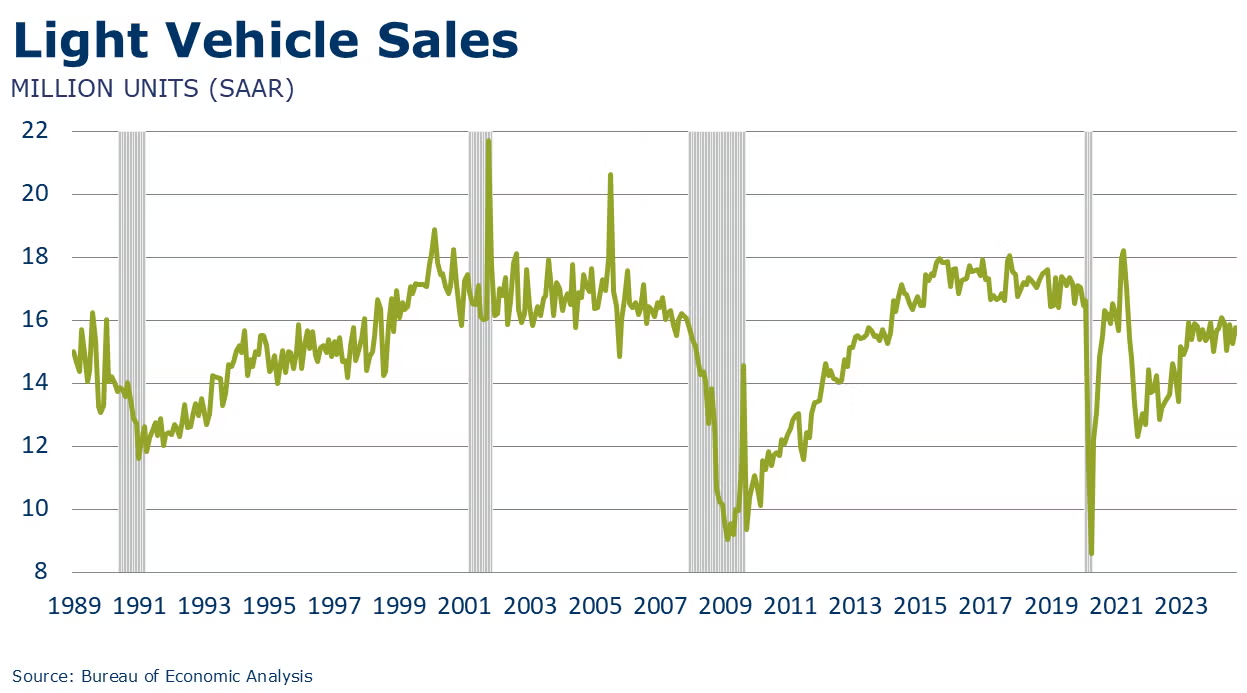
Light vehicle sales levels have been choppy this year. After falling 3.8% in August, sales rose 3.3% in September to a 15.8 million seasonally adjusted annual rate (SAAR).
Headline factory orders fell 0.2% in August following a 4.9% advance in July. Orders for core business goods (nondefense capital goods excluding aircraft) rose by 0.3%. Autos and auto parts orders were flat while orders were higher in construction materials, IT goods, defense capital goods and consumer durable goods. Unfilled orders (a measure of the manufacturing pipeline) rose 0.4%. Manufacturers’ shipments declined 0.5% and inventories rose by 0.1%. The inventories-to-shipments ratio was 1.46, up from 1.45 in July.
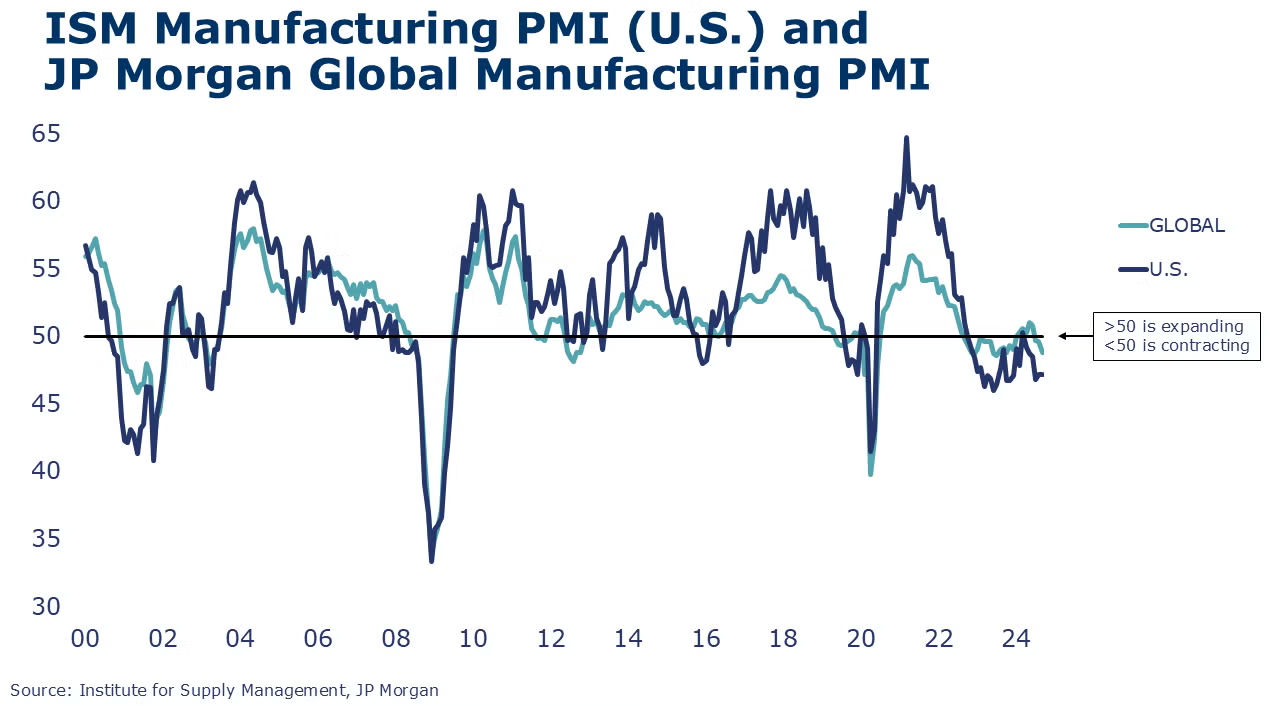
The ISM Manufacturing PMI® was unchanged at 47.2% in September. A reading below 50 indicates a contraction in manufacturing activity, and September marked the 22nd month in the past 23 that the index has been below 50. Production, backlogs, new orders, exports, and employment all contracted. Supplier deliveries were slower. Raw materials inventories contracted in September while customers’ inventories were assessed as “about right”.
Looking abroad, the JP Morgan Global Manufacturing PMI signaled contraction for the third month in a row in September. Global manufacturing output, new orders, stocks of purchases, and employment all declined in August. A weakening trend in international trade was noted as the index for new export orders hit a low. Many of the nations for which PMI data were available registered stagnating or deteriorating manufacturing activity. Within segments, output contracted in intermediate and investment goods while consumer goods continued to expand modestly.
The ISM Services PMI® rose 3.4 points to 54.9% in September. Over the 50-mark, the reading indicates expansion in economic activity in the US services sector over the month. It was the 49th time in 52 months that services grew. Business activity was up, new orders were up, and supplier deliveries were slower (indicating stronger customer demand). The employment index suggests contraction in service jobs.
ENERGY
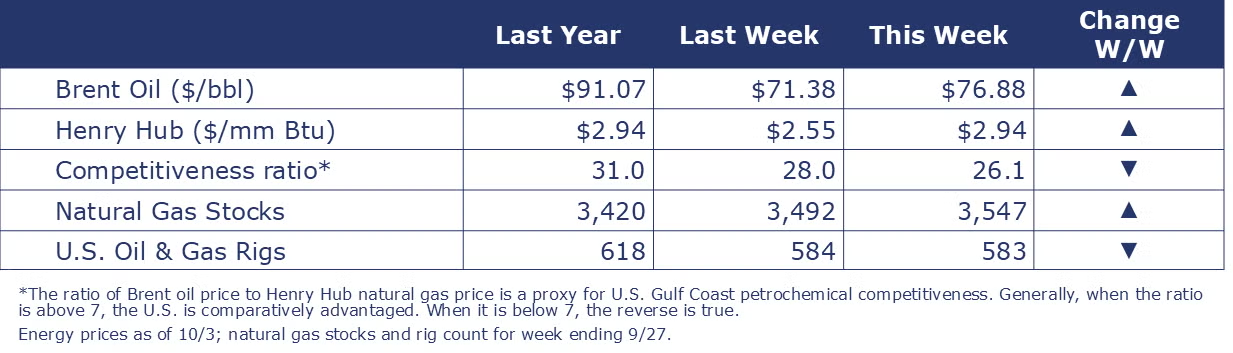
Oil prices were higher following discussion around an Israeli strike of Iranian oil facilities. U.S. natural gas prices also trended higher as cool weather enters the forecast. Lower than average inventory builds in recent months have allowed the cushion of extra gas in storage to move closer to the five-year historical average. The combined oil and gas rig count fell by one to 583.
CHEMICALS
Indicators for the business of chemistry suggest a yellow banner.
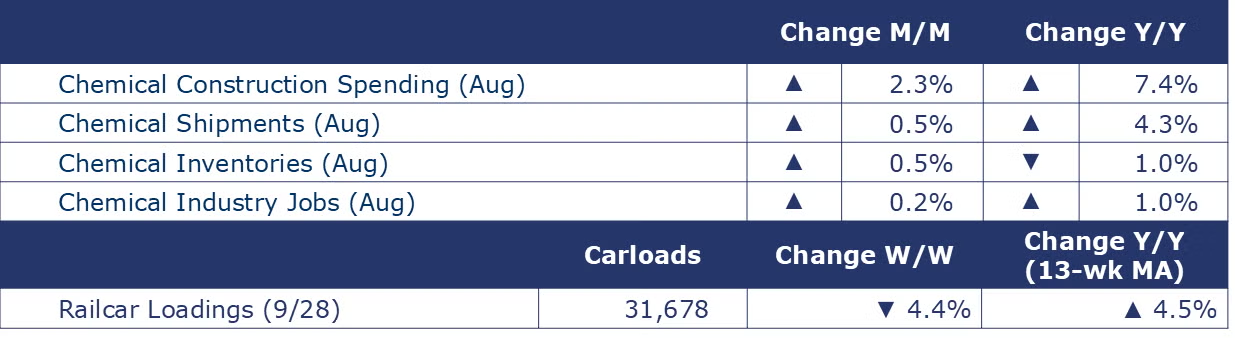
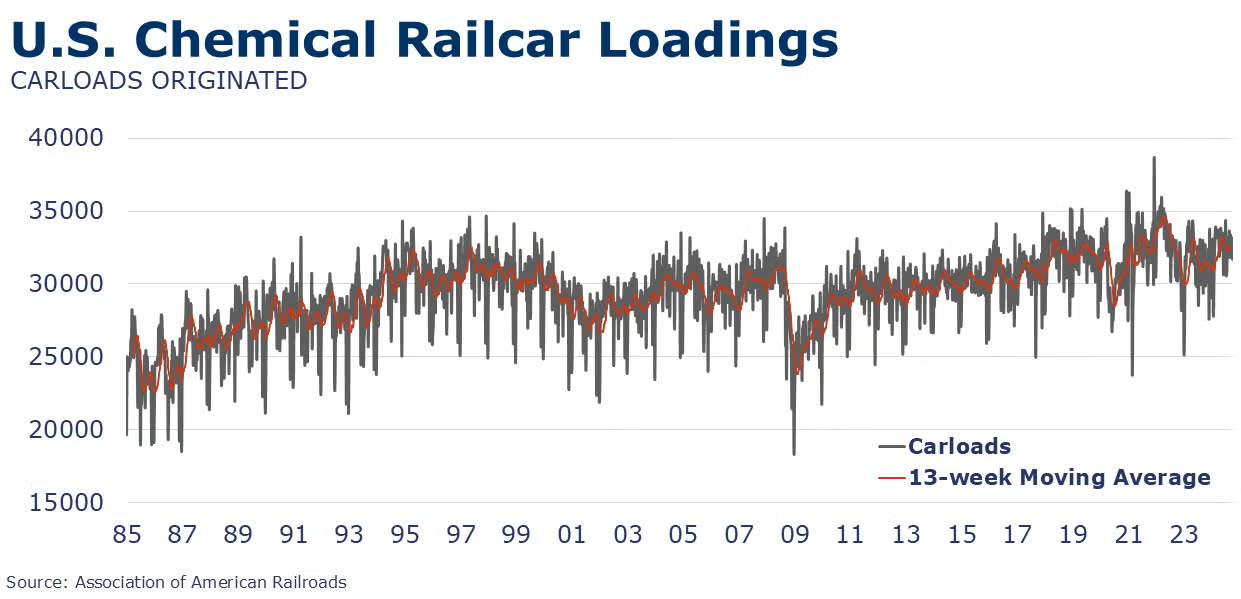
According to data released by the Association of American Railroads, chemical railcar loadings were down to 31,678 for the week ending September 28. Loadings were up 4.5% Y/Y (13-week MA), up (4.2%) YTD/YTD and have been on the rise for 7 of the last 13 weeks.
Within the details of the ISM Manufacturing PMI® report, the chemical industry was reported to have contracted in September. Production, new orders, employment, and order backlogs were lower. Chemical import volumes were reported to be higher. The chemical industry was among eight industries reporting no change in supplier deliveries. Chemical manufacturers’ inventories were lower and their customers’ inventories were deemed as too low. One chemical industry respondent noted, “North America demand has started to weaken. Asian demand is slightly higher but shows signs of weakness in future months. Comments tied to automotive builds.”
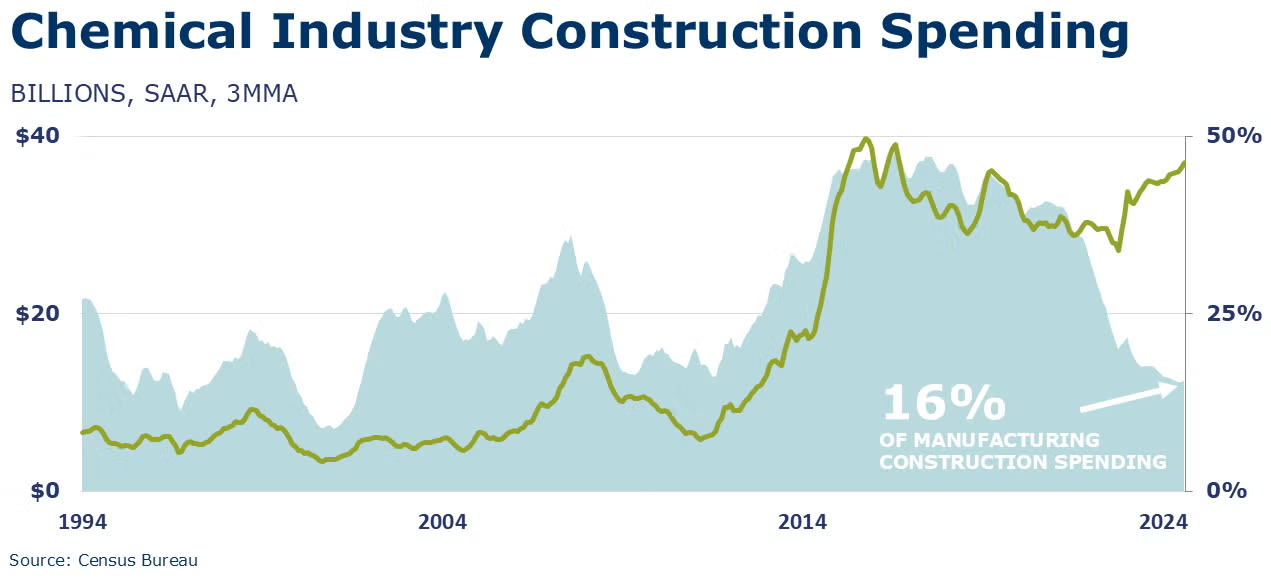
Chemical construction spending rose by 2.3% to $37.6 billion in August, a level 7.4% higher than a year ago. Chemical construction spending represents about 16% of total manufacturing construction spending.
Chemical shipments rose 0.5% in August, the seventh consecutive monthly gain. Gains in shipments occurred in agricultural and other chemicals as well as coatings & adhesives. Chemical inventories rose by 0.5% as gains in inventories of coatings & adhesives and other chemicals offset lower inventories of agricultural chemicals. Compared to a year ago, shipments were up 4.3% Y/Y and inventories were off 1.0% Y/Y. The inventories-to-sales ratio edged down to 1.17, which was lower than last August’s ratio of 1.24.
Chemical industry employment expanded in August, up 0.2% to 558,500, a level 1.0% above year ago levels. Employment in plastic resin manufacturing was also higher, up 0.7% to 61,500. Resin manufacturing was 2.1% lower than a year ago, however. (Note that data at the detailed industry level are lagged one month behind the headline jobs report.)
In September, chemical and pharmaceutical industry employment edged slightly lower to 902,200. Average hourly earnings rose by 3.1% Y/Y, a faster pace than the previous three months. Average weekly hours rose by 18 minutes to 40.8 hours. A gain in the number of production workers was more than offset by lower employment in supervisory and non-production workers. With gains in the number of production workers and weekly hours, the total labor input into chemical and pharmaceutical manufacturing edged slightly higher, in contrast to the ISM Manufacturing PMI report.
Note On the Color Codes
Banner colors reflect an assessment of the current conditions in the overall economy and the business chemistry of chemistry. For the overall economy we keep a running tab of 20 indicators. The banner color for the macroeconomic section is determined as follows:
Green – 13 or more positives
Yellow – between 8 and 12 positives
Red – 7 or fewer positives
There are fewer indicators available for the chemical industry. Our assessment on banner color largely relies upon how chemical industry production has changed over the most recent three months.
For More Information
ACC members can access additional data, economic analyses, presentations, outlooks, and weekly economic updates through ACCexchange.
In addition to this weekly report, ACC offers numerous other economic data that cover worldwide production, trade, shipments, inventories, price indices, energy, employment, investment, R&D, EH&S, financial performance measures, macroeconomic data, plus much more. To order, visit http://store.americanchemistry.com/.
Every effort has been made in the preparation of this weekly report to provide the best available information and analysis. However, neither the American Chemistry Council, nor any of its employees, agents or other assigns makes any warranty, expressed or implied, or assumes any liability or responsibility for any use, or the results of such use, of any information or data disclosed in this material.
Contact us at ACC_EconomicsDepartment@americanchemistry.com.


