MACROECONOMY & END-USE MARKETS
Running tab of macro indicators: 9 out of 20

The number of new jobless claims fell by 19,000 to 241,000 during the week ending October 12. Continuing claims increased by 9,000 to 1.867 million, and the insured unemployment rate for the week ending October 5 was unchanged at 1.2%.
Existing home sales fell 1.0% to a 3.84 million seasonally adjusted annual rate in September, a 14-year low and down 3.5% Y/Y. Inventories of existing homes expanded by 1.5% compared to August, equivalent to 4.3 months’ supply at the current sales pace, the highest in four years. The median sales price climbed 3.0% Y/Y to $404,500.
New home sales rose 4.1% to a 738,000 million seasonally adjusted annual rate in September, the highest pace since May 2023 and up 6.3% Y/Y. Because new home sales are recorded when a contract is signed, rather than after a transaction closes as with existing home sales, it may be an encouraging sign that lower interest rates are motivating buyers to come off the sidelines. The inventory of unsold new homes edged slightly higher. As a result, months’ supply eased from 7.9 months in August to 7.6 months in September.

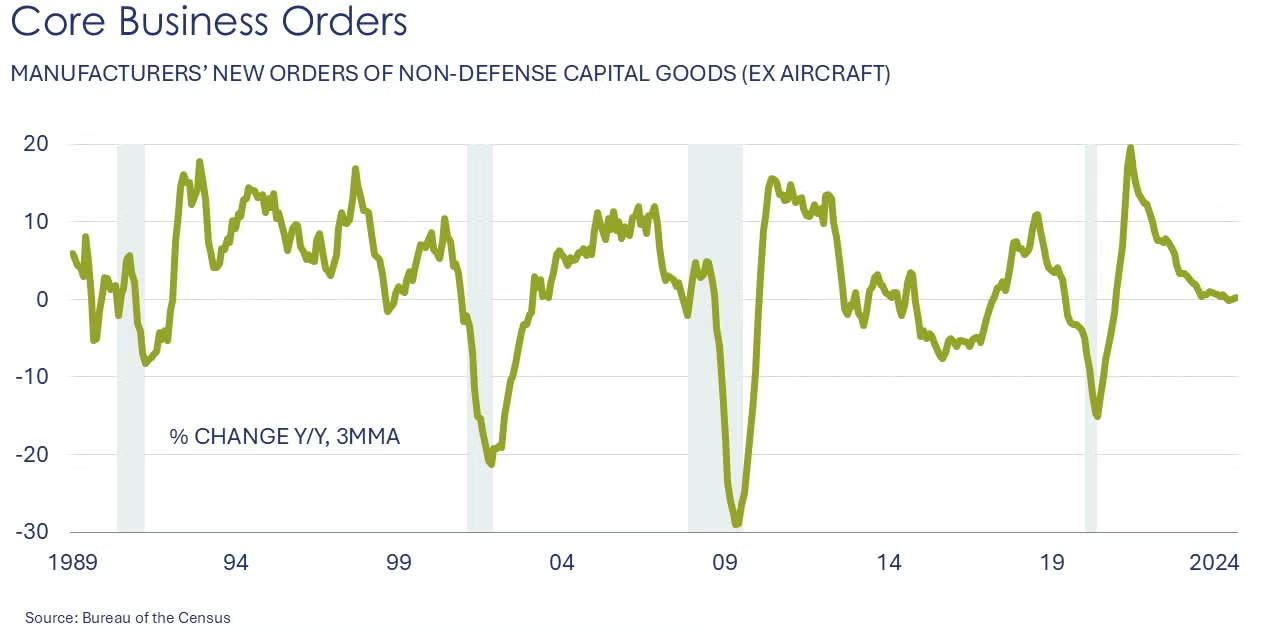
Orders for long-lasting durable goods fell for a second month by 0.8%. Orders were sharply lower for both defense and civilian aircraft and orders for machinery and some electronics categories were also lower. Those declines were partially offset by higher orders for motor vehicles, metals, metal products, computers, and communications equipment. A proxy for business investment, orders for nondefense capital equipment (excluding aircraft) rose for a second month, up by 0.5%. Compared to a year ago, headline orders were off 2.9% Y/Y while core business orders were higher by 0.6% Y/Y.
Global semiconductor sales rose across all regions to $53.1 billion. The largest monthly gain was in the Americas region. Sales were up 20.6% Y/Y with double-digit increases in the Americas, China, and Asia Pacific/All Other regions.

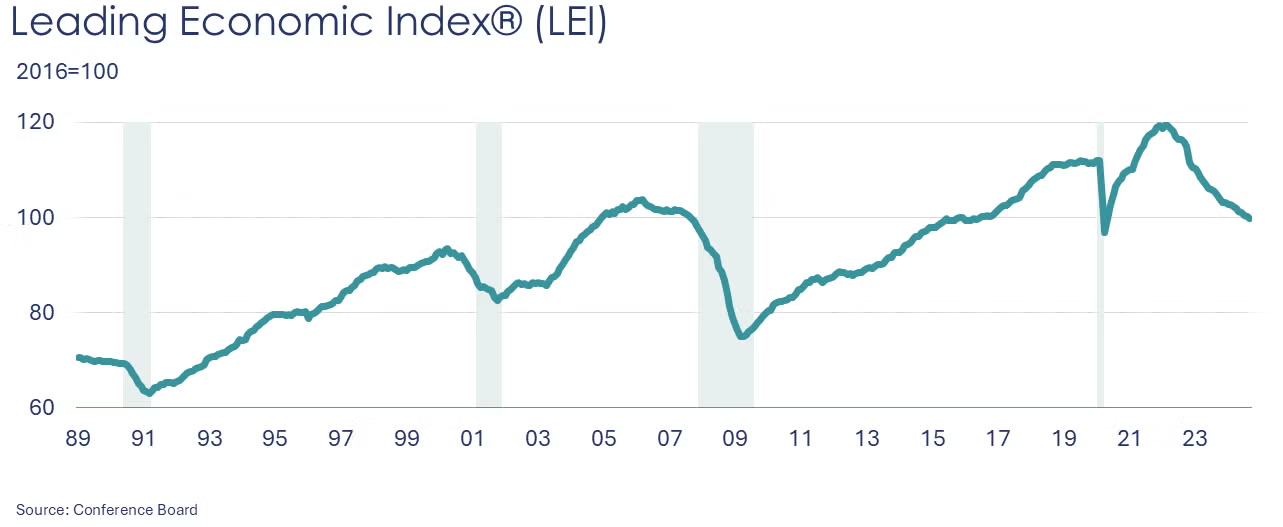
The Conference Board Leading Economic Index® (LEI) for the U.S. declined by 0.5% to 99.7 in September. Over the six-month period from March to September 2024, the LEI declined by 2.6% (an accelerated pace compared to 2.2% decline over the previous six months). The LEI signals weakness ahead.
Manufacturing activity in the Fed’s Fifth District (Richmond+Baltimore+Charlotte) remained depressed though the composite manufacturing index improved from -21 to -14 in October. Shipments, new orders, and employment all declined over the month. Firms expect an improved situation looking six months ahead and anticipate rising shipments and new orders.
Federal Reserve Beige Book
- On balance, economic activity was little changed in nearly all Districts since early September, though two Districts reported modest growth.
- Most Districts reported declining manufacturing activity.
- Activity in the banking sector was generally steady to up slightly, and loan demand was mixed, with some Districts noting an improvement in the outlook due to the decline in interest rates.
- Reports on consumer spending were mixed, with some Districts noting shifts in the composition of purchases, mostly toward less expensive alternatives.
- Housing market activity has generally held up: inventory continued to expand in much of the nation, and home values largely held steady or rose slightly. Still, uncertainty about the path of mortgage rates kept some buyers on the sidelines, and the lack of affordable housing remained a persistent problem in many communities.
- Commercial real estate markets were generally flat, although data center and infrastructure projects boosted activity in a few Districts.
- The short-lived dockworkers strike caused only minor temporary disruptions. Hurricane damage impacted crops and prompted pauses in business activity and tourism in the Southeast.
- Agricultural activity was flat to down modestly, with some crop prices remaining unprofitably low.
- Energy activity was also unchanged or down modestly, and lower energy prices reportedly compressed producers’ margins.
- Despite elevated uncertainty, contacts were somewhat more optimistic about the longer-term outlook.
ENERGY

Oil prices were higher this week on growing concerns related to geopolitical risk. There were new reports of North Korean troops ready to help Russia in its war in Ukraine and an escalation in fighting between Israel and Hezbollah. U.S. natural gas remained below $2.50 as mild weather continues to allow solid inventory builds.
Natural gas inventories continued to build last week, up by 80 BCF as mild weather tempered demand. The combined oil and gas rig count fell by 1 to 581.
CHEMICALS
Indicators for the business of chemistry suggest a yellow banner.

In the Fed Beige Book, the Fifth District noted “a chemical manufacturer reported a dry talent pool for applicants and was using outside agencies for help.”

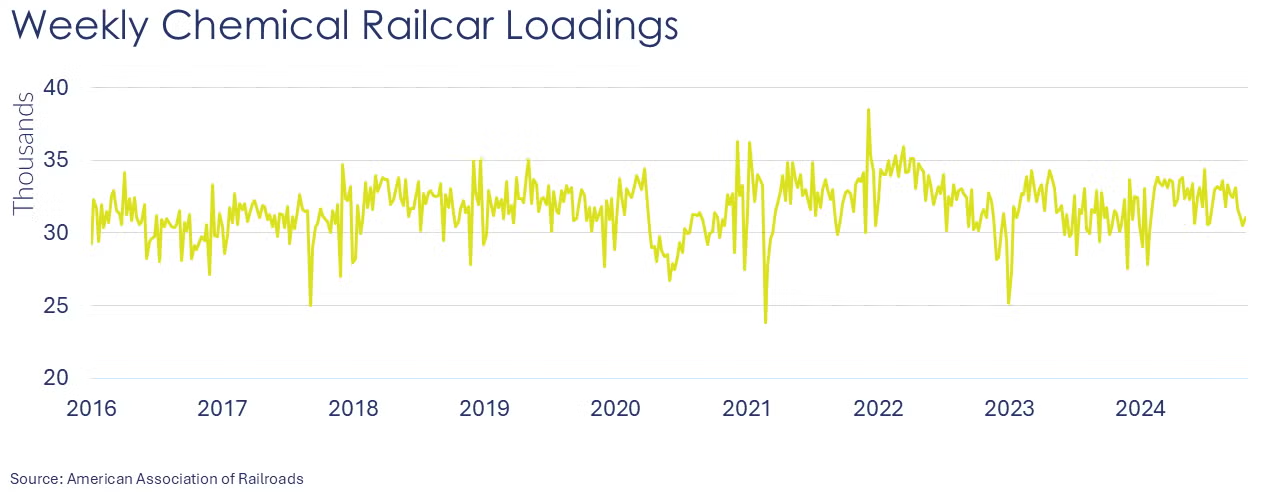
According to data released by the Association of American Railroads, chemical railcar loadings were up to 31,081 for the week ending October 19. Loadings were up 3.2% Y/Y (13-week MA), up (3.9%) YTD/YTD and have been on the rise for 6 of the last 13 weeks.
Following a 0.1% loss in August, the U.S. CPRI declined again in September (-0.4%). The CPRI measures chemical production trends on a three-month moving average (3MMA) to smooth month-to-month volatility. Chemical production declined in all regions, with the West Coast region seeing the most decline. The U.S. CPRI is 0.1% higher than a year ago.

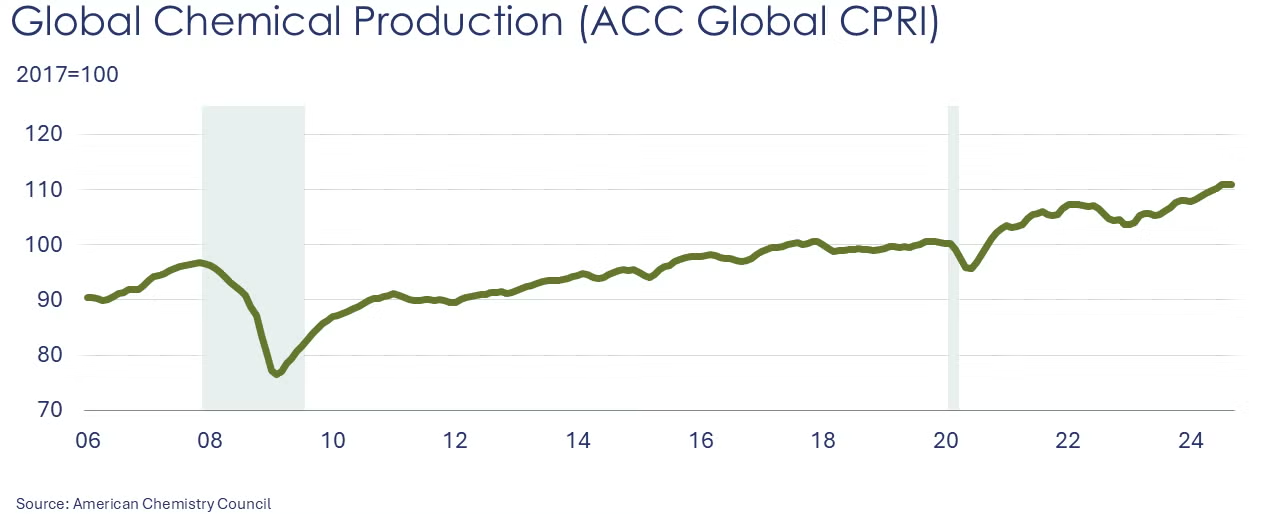
Following weakness in August (0%), ACC’s Global Chemical Production Regional Index (Global CPRI) remained muted (0%) in September. Improvements in Asia, South America, and the former Soviet Union offset declines in North America and Europe. China continued to contribute to global growth despite production impacted by Typhoon Bebinca. After seven months of consecutive growth, Germany’s recovery paused as the economy struggled with a weak manufacturing sector. On a segment basis, strength in agricultural and specialty chemicals offset weakness in basics and consumer chemicals. Global chemicals production growth was up 3.8% Y/Y.
Note On the Color Codes
Banner colors reflect an assessment of the current conditions in the overall economy and the business chemistry of chemistry. For the overall economy we keep a running tab of 20 indicators. The banner color for the macroeconomic section is determined as follows:
Green – 13 or more positives
Yellow – between 8 and 12 positives
Red – 7 or fewer positives
There are fewer indicators available for the chemical industry. Our assessment on banner color largely relies upon how chemical industry production has changed over the most recent three months.
For More Information
ACC members can access additional data, economic analyses, presentations, outlooks, and weekly economic updates through ACCexchange: https://accexchange.sharepoint.com/Economics/SitePages/Home.aspx
In addition to this weekly report, ACC offers numerous other economic data that cover worldwide production, trade, shipments, inventories, price indices, energy, employment, investment, R&D, EH&S, financial performance measures, macroeconomic data, plus much more. To order, visit http://store.americanchemistry.com/.
Every effort has been made in the preparation of this weekly report to provide the best available information and analysis. However, neither the American Chemistry Council, nor any of its employees, agents or other assigns makes any warranty, expressed or implied, or assumes any liability or responsibility for any use, or the results of such use, of any information or data disclosed in this material.
Contact us at ACC_EconomicsDepartment@americanchemistry.com.


