MACROECONOMY & END-USE MARKETS
Running tab of macro indicators: 9 out of 20
The number of new jobless claims fell by 19,000 to 241,000 during the week ending October 12. Continuing claims increased by 9,000 to 1.867 million, and the insured unemployment rate for the week ending October 5 was unchanged at 1.2%.
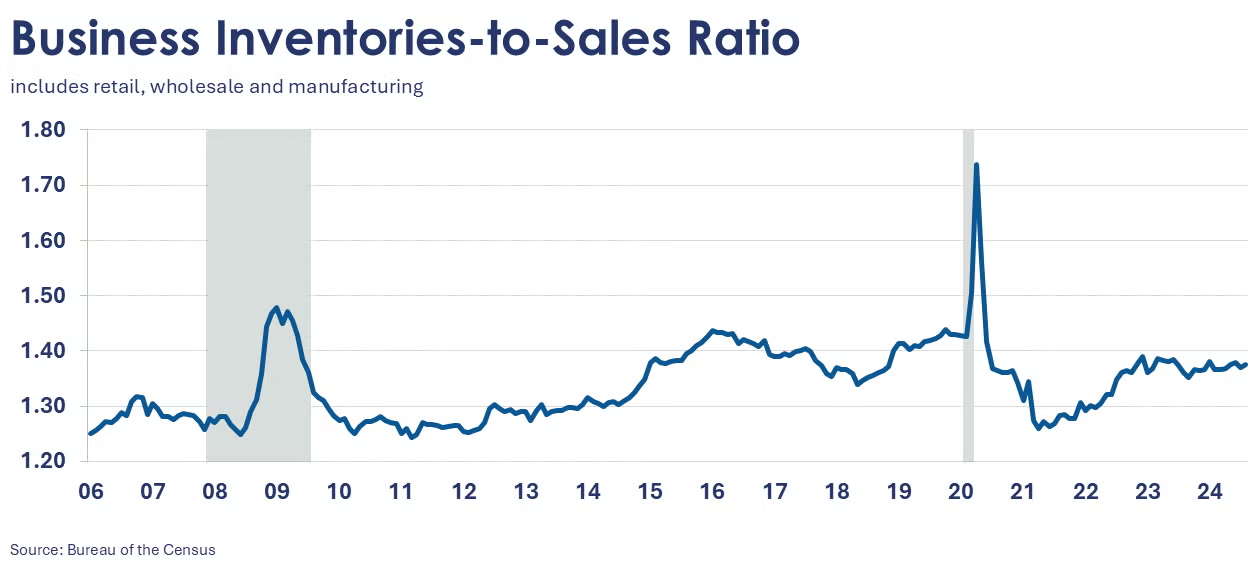
Combined business inventories (of manufacturers, wholesalers, and retailers) rose 0.3% in August, following a similar gain in July. Inventories were higher across all major segments, but the largest gain was in retail. Business sales eased, however, by 0.3% following a 1.1% gain in July. Sales were lower at manufacturers and wholesalers; retail sales were flat in August. The inventories-to-sales ratio ticked higher to 1.38 (from 1.37 in July). The ratio was higher than a year ago when it stood at 1.36.
Housing starts were down by 0.5% in September to a 1.354 million seasonally adjusted annual rate (SAAR). Single-family starts were up 2.7% reflecting gains in the Northeast and South. Forward-looking building permits were down 2.9% compared to August. Compared to a year ago, building permits were down 5.7% while housing starts were down by 0.7%.
Retail sales rose by a better-than-expected 0.4% in September. Spending accelerated across a number of discretionary categories, including restaurants, clothing, general merchandise, and sporting goods & hobby stores. Sales of furniture and electronics were lower, as were gas station sales. Sales of motor vehicles were flat, following a decline in August. Compared to a year ago, retail sales were up by 1.7% Y/Y.
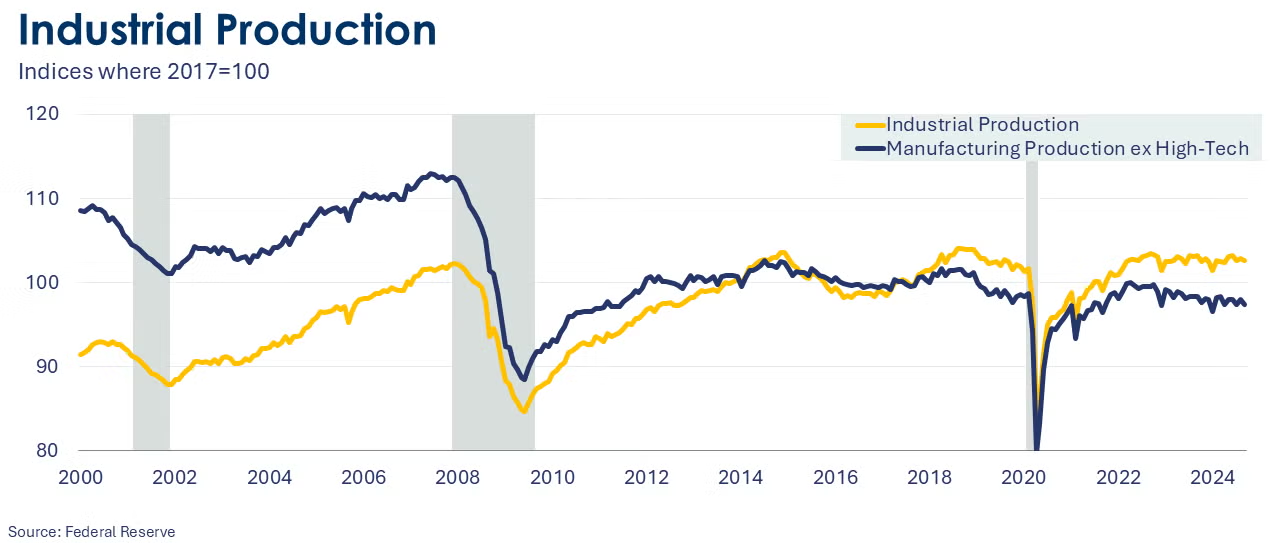
Industrial production slid 0.3% in September as multiple disruptions from hurricanes and strikes impacted the nation’s industrial base. Utility output was up, but mining output was lower, in part due to oil & gas shut ins in the Gulf of Mexico due to several September hurricanes. Manufacturing production declined 0.4%, led by sharply lower output from the aerospace sector due to the Boeing strike. Output was also lower in electrical equipment, motor vehicles, furniture, apparel and textiles. Those declines were partially offset by production gains in wood products, primary metals, petroleum products, and printing. Compared to a year ago, headline industrial production was down 0.6%. Capacity utilization eased by 0.3 points to 77.5%. That was lower than last September’s 78.9% rate. Over the past year, overall industrial capacity expanded by 1.2%.
U.S. import prices fell 0.4% in September as prices for fuel imports declined by 7.0% and prices of nonfuel imports were roughly stable (up 0.1%). Over the past 12 months, import prices have moderated by 0.1%. Export prices declined in September and were down by 0.7% as a decline in non-ag exports prices offset a gain in agricultural exports prices. Over the past 12 months, export prices have declined by 2.1%.
SURVEY OF ECONOMIC FORECASTERS
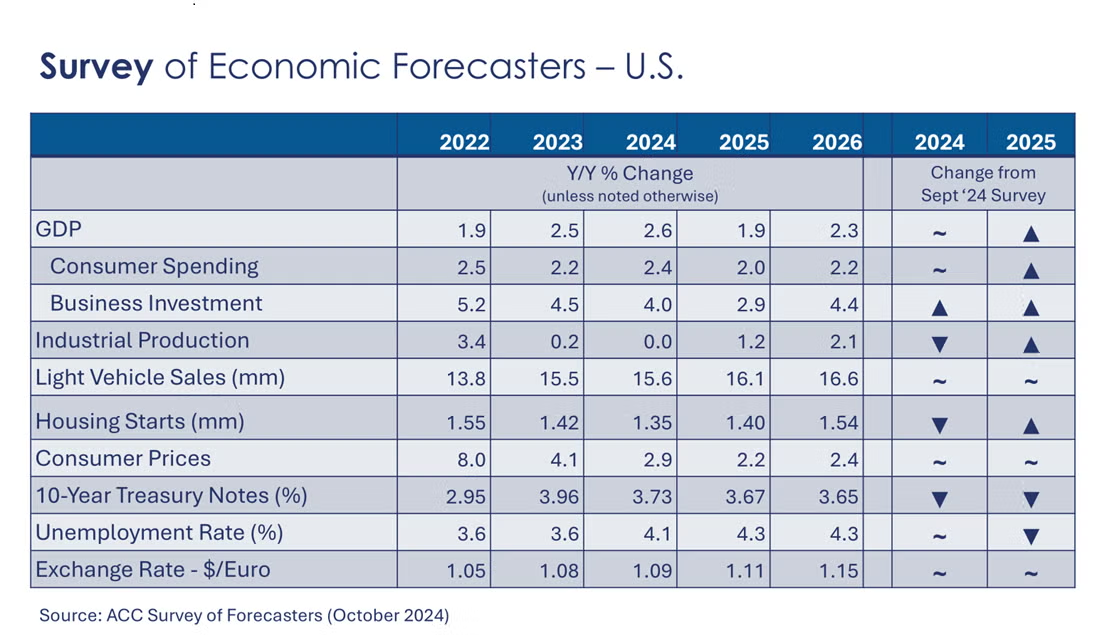
At the beginning of the last quarter of 2024, expectations remained stable for a year of solid growth in the U.S. economy. With the Fed’s 50-basis point cut in September, the outlook has improved across many indicators for 2025.
- With a boost from better-than-expected Q2 results, U.S. GDP is expected to grow by 2.6% in 2024 and by 1.9% in 2025.
- Growth in consumer spending is expected to come in higher than in 2023 at a 2.4% pace in 2024 before easing to a 2.0% gain in 2025.
- Business investment has remained stronger than expected despite higher borrowing costs and is expected to grow by 4.0% in 2024 before slowing to a 2.9% pace in 2025.
- Following a 0.2% gain in 2023, we look for industrial production to be essentially flat in 2024 before firming to a 1.2% pace in 2025. Growth is uneven among industries, however.
- Sales of autos and light trucks are expected to grow to 15.6 million in 2024 (still below trend) before rising to a 16.1 million pace in 2025, lower than a month ago.
- Housing expectations were also revised lower. Housing starts are expected to come in at 1.35 million in 2024 before rising to a 1.40 million pace in 2025 as mortgage rates continue to ease into next year.
- The unemployment rate is expected to move higher as the labor market rebalances averaging 4.1% in 2024 and 4.3% in 2025.
- Recent data shows slow progress on inflation. Growth in consumer prices is expected to slow a 2.9% pace in 2024 and 2.2% in 2025.
- With a 50-basis point cut to the Federal Funds rate, a cycle of monetary easing has begun. As a result, expectations for 10-year Treasury yields eased for 2024 and 2025.
ENERGY
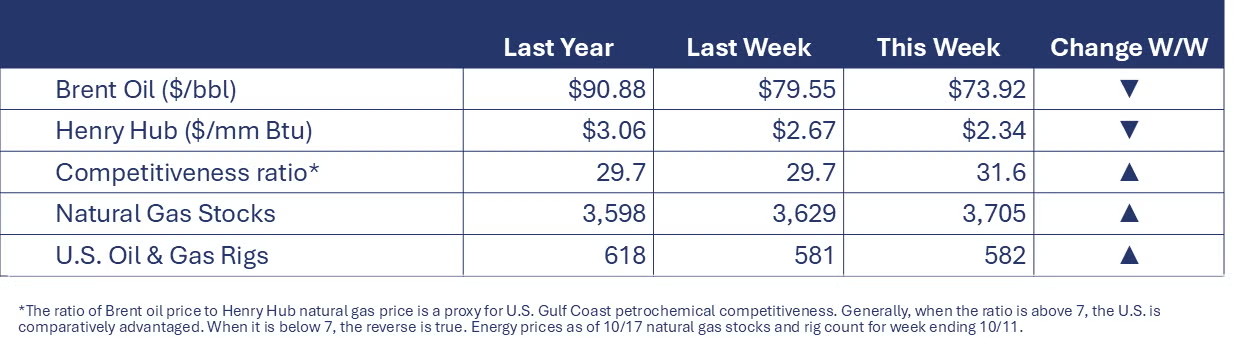
Oil prices eased this week after reports that Israel will not strike Iran’s oil facilities. U.S. natural gas prices were down slightly as last week’s storage build was slightly higher than expected. The combined oil & gas rig count rose by one to 582.
CHEMICALS
Indicators for the business of chemistry suggest a yellow banner.
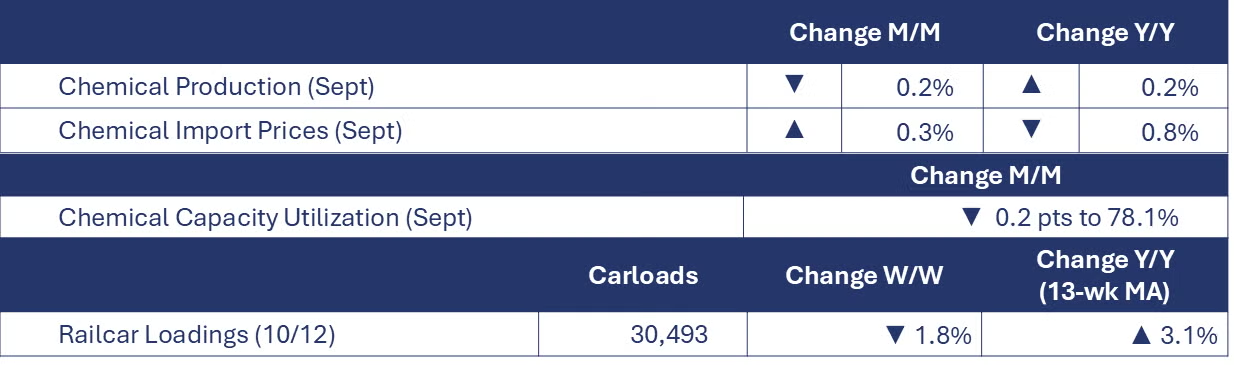

According to data released by the Association of American Railroads, chemical railcar loadings were down to 30,493 for the week ending Oct 12. Loadings were up 3.1% Y/Y (13-week MA), up (4.1%) YTD/YTD and have been on the rise for 6 of the last 13 weeks.
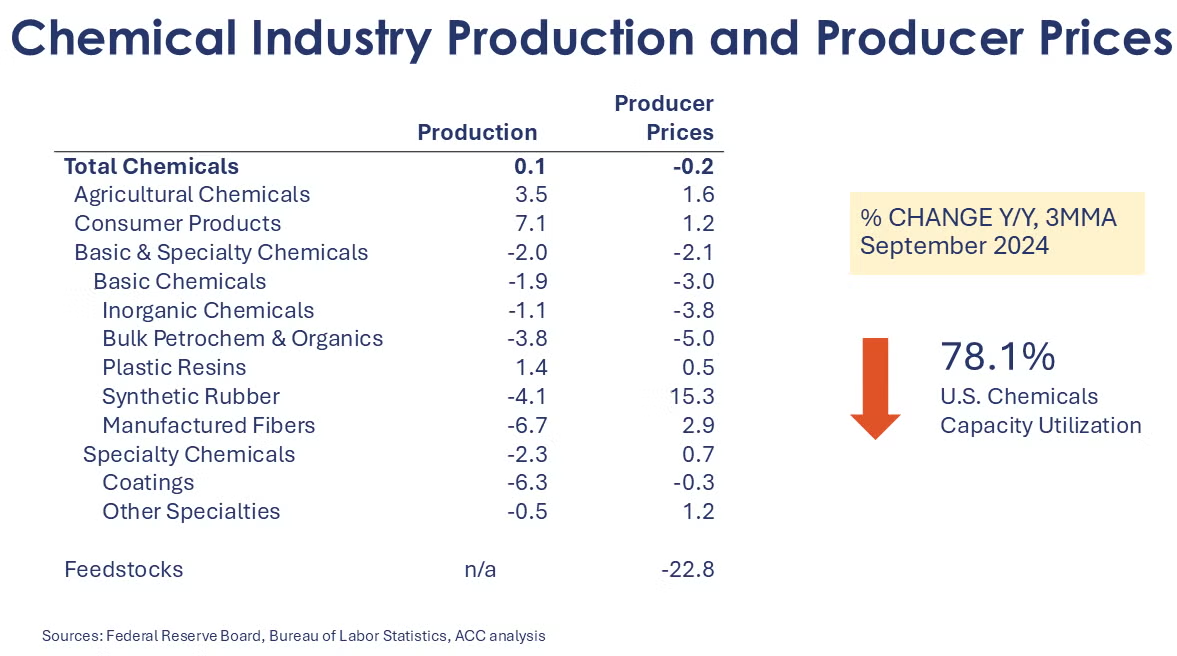
Chemical production eased by 0.2% in September, giving back gains in August. Declines in the production of resins, synthetic rubber, manufactured fibers, coatings, fertilizers, and crop protection chemicals offset gains in the output of basic organic and inorganic chemicals, other specialty chemicals, and consumer products. Chemical production was slightly ahead of year ago levels, up by 0.2% Y/Y. Chemical capacity utilization eased from 78.3% in August to 78.1% in September. It was also lower than September 2023 when capacity utilization was 78.8%.
U.S. chemical import prices rose by 0.3% in September and were down by 0.8% Y/Y. Chemical export prices rose by 0.1% and were up by 1.0% Y/Y.
Note On the Color Codes
Banner colors reflect an assessment of the current conditions in the overall economy and the business chemistry of chemistry. For the overall economy we keep a running tab of 20 indicators. The banner color for the macroeconomic section is determined as follows:
Green – 13 or more positives
Yellow – between 8 and 12 positives
Red – 7 or fewer positives
There are fewer indicators available for the chemical industry. Our assessment on banner color largely relies upon how chemical industry production has changed over the most recent three months.
For More Information
ACC members can access additional data, economic analyses, presentations, outlooks, and weekly economic updates through ACCexchange.
In addition to this weekly report, ACC offers numerous other economic data that cover worldwide production, trade, shipments, inventories, price indices, energy, employment, investment, R&D, EH&S, financial performance measures, macroeconomic data, plus much more. To order, visit http://store.americanchemistry.com/.
Every effort has been made in the preparation of this weekly report to provide the best available information and analysis. However, neither the American Chemistry Council, nor any of its employees, agents or other assigns makes any warranty, expressed or implied, or assumes any liability or responsibility for any use, or the results of such use, of any information or data disclosed in this material.
Contact us at ACC_EconomicsDepartment@americanchemistry.com.


