MACROECONOMY & END-USE MARKETS
Running tab of macro indicators: 11 out of 20
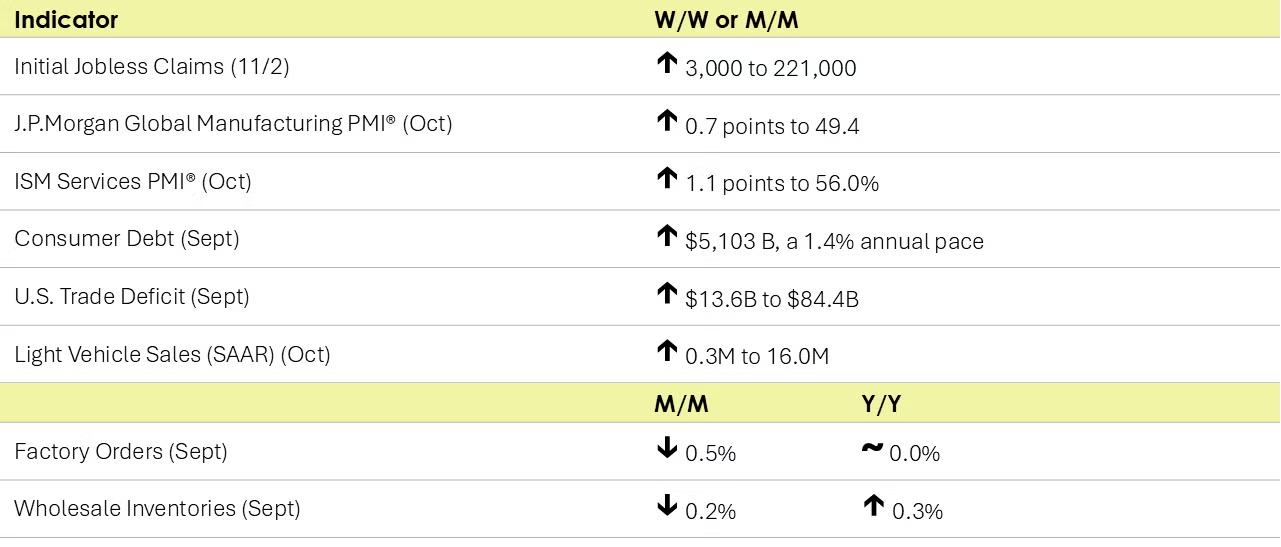
Following a 50 basis point rate cut in September, the Fed’s Federal Market Open Committee (FOMC) cut interest rates again by a quarter percentage point, putting the federal funds rate at 4½ - 4¾% . The move was widely expected. The Fed noted progress toward the 2% target (in the core PCE price index), but that inflation remains “somewhat elevated”. The FOMC remains attentive to the risks to both sides of its dual mandate – price stability and maximum employment.
The number of new jobless claims rose by 3,000 to 221,000 during the week ending November 2. Continuing claims increased by 39,000 to 1.892 million, and the insured unemployment rate for the week ending October 26 was unchanged at 1.2%.
Non-mortgage consumer debt expanded at a 1.4% annual rate to 5,103 billion in September. Revolving debt balances (e.g., credit cards) rose (following a decline in August). Non-revolving debt (e.g., auto and student loans) also expanded, though at a slower pace than in August.
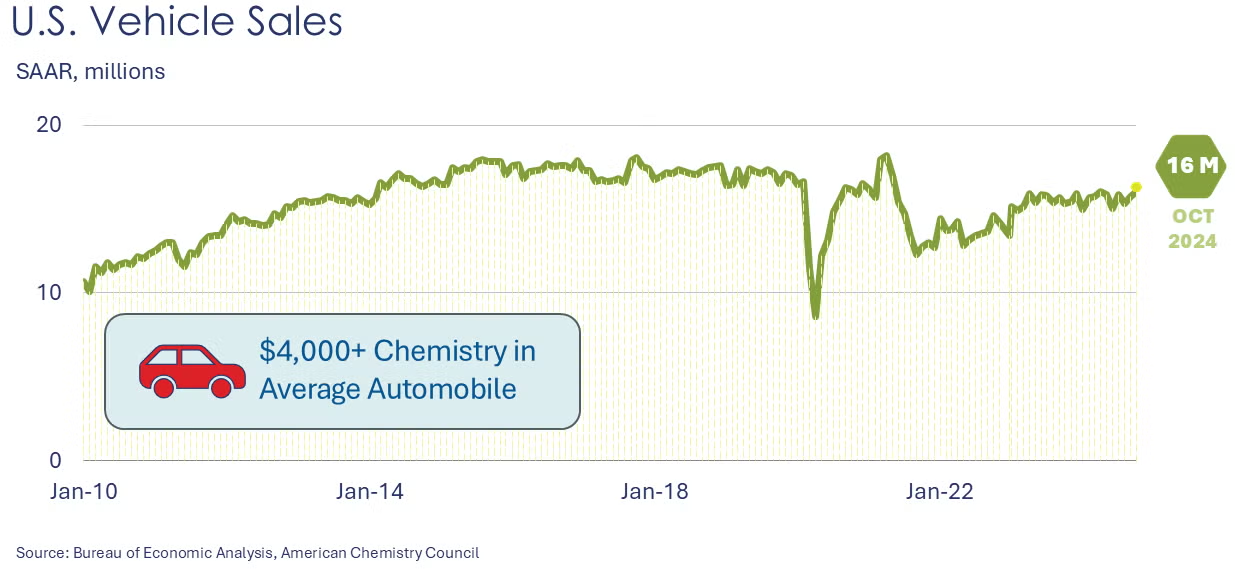
Light vehicle sales levels rose by 0.3 million to a 16.0 million unit seasonally adjusted annual pace in October. Sales were 4.5% higher than in the same period last year.
Wholesale inventories retreated in September, down 0.2%, following a similar gain in August. The largest inventory drawdowns were in automotive, professional equipment, computer equipment, petroleum products, and apparel. The largest gain was in groceries. Sales at the wholesale level expanded 0.3% in September, after a 0.2% gain in August. The largest gains were in metals farm products, apparel, and drugs. The inventories-to-sales ratio eased from 1.35 in August to 1.34 in September. A year ago, the ratio was 1.33. Sales were off 0.4% Y/Y while inventories were 0.3% higher Y/Y.
The ISM Services PMI® rose by 1.1 points to 56.0% in October indicating accelerated expansion in the services sector. It was the highest reading in more than 2 years and the 50th time in the last 53 months that the index pointed to expansion. Services growth was broad with all but two industries tracked reporting expansion. Recent hurricanes and port labor challenges impacted businesses in varied ways. Some realized less disruption than anticipated. Damage and destruction in some areas led to increased demand for equipment and goods. Overall, new orders were reported as growing but at a slower pace. Employment moved from contraction to expansion territory. Inflationary pressure remains but is easing.
U.S. factory orders fell 0.5% in September and have declined in four of the last five months. New orders for core business goods (nondefense capital goods excluding aircraft) rose by 0.7%. Unfilled orders (a measure of the manufacturing pipeline) rose 0.2%. Manufacturers’ shipments declined 0.4% and inventories declined by 0.2%. The inventories-to-shipments ratio was 1.46 for the second month in a row.
The U.S. trade deficit in goods and services deepened by 19.2% in September to $84.4 billion as exports declined 1.2% and imports increased 3.0%. Goods exports declined in civilian aircraft, pharma, crude oil and other petroleum products. Goods imports rose in pharma, computers, semiconductors, autos and parts, and industrial supplies and materials. The planned East Coast ports strike likely pulled trade forward as importers stocked up to avoid the pending disruption.
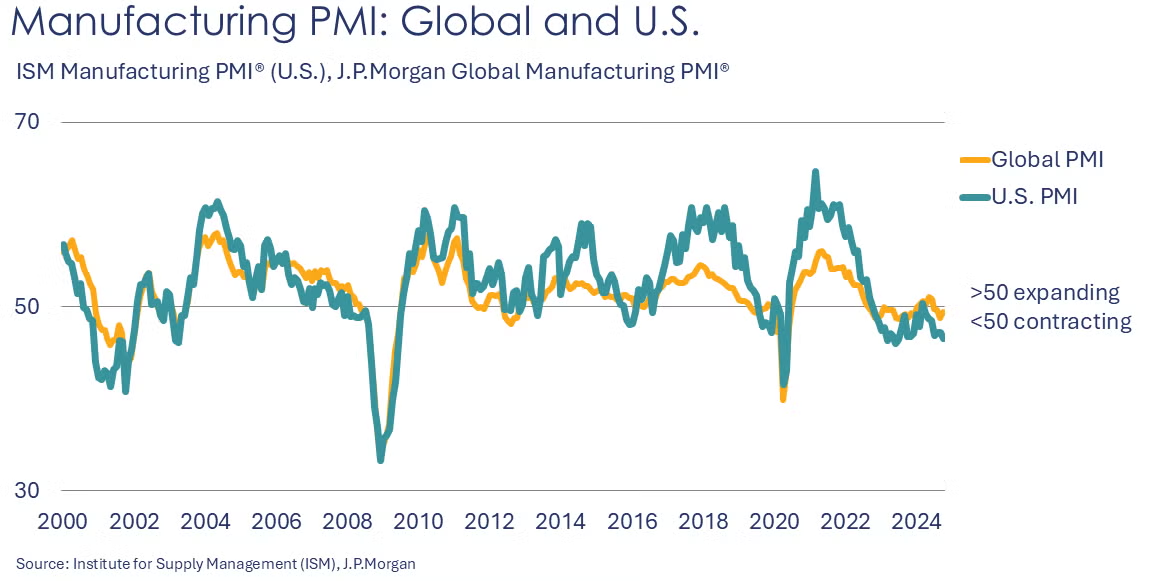
The J.P.Morgan Global Manufacturing PMI® continued to signal deterioration in global manufacturing in October. The index rose 0.7 points to 49.4, below the 50-mark for the fourth month in a row. New orders, new export orders, and employment declined. The output index rose 0.9 points to 50.1. Conditions continued to deteriorate for investment and intermediate goods but improved for consumer goods. Trade volumes weakened.
ENERGY

Oil prices were slightly higher than a week ago as OPEC+ announced it would delay until January a planned output hike. U.S. natural gas prices were slightly lower than a week ago on continued gains in inventories. Natural gas inventories continued to climb last week as unseasonably warm weather persisted across much of the U.S. Inventories were nearly 6% above average heading into the winter heating season expected to begin in the next few weeks.
The combined oil & gas rig count remained steady at 581.
CHEMICALS
Indicators for the business of chemistry suggest a yellow banner.
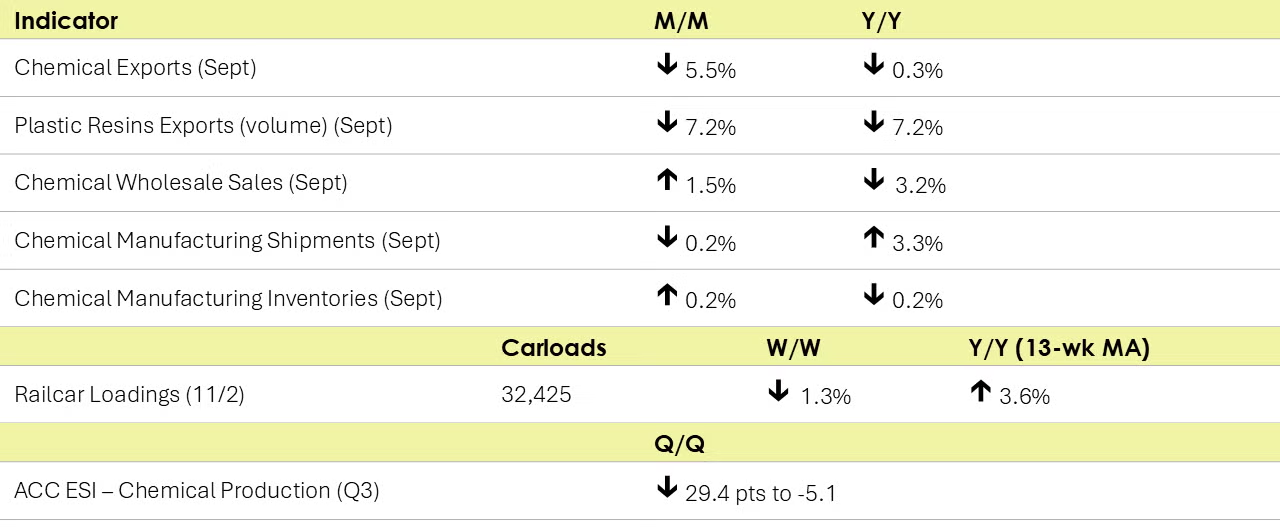
According to data released by the Association of American Railroads, chemical railcar loadings were down to 32,425 for the week ending November 2. Loadings were up 3.6% Y/Y (13-week MA), up (4.0%) YTD/YTD and have been on the rise for 5 of the last 13 weeks.
U.S. chemical exports were down 5.5% in September reflecting declines in all categories except inorganics and other basic chemicals. Chemical imports were down by 1.5% as declines occurred across all categories except agricultural chemicals, synthetic fibers, and other basic chemicals. The U.S. chemicals trade surplus dropped to $2.9 billion in September and is $21.4 billion YTD. Compared to the same month last year, exports were down 0.3% Y/Y and imports were up 2.6% Y/Y.
U.S. plastic resins exports declined by 3.1% in September to a level up 3.5% Y/Y on a USD$ value basis. On a volume comparison, at 1.9 million metric tons exported in September, plastic resins exports were down 7.2% from August and down 7.2% Y/Y.
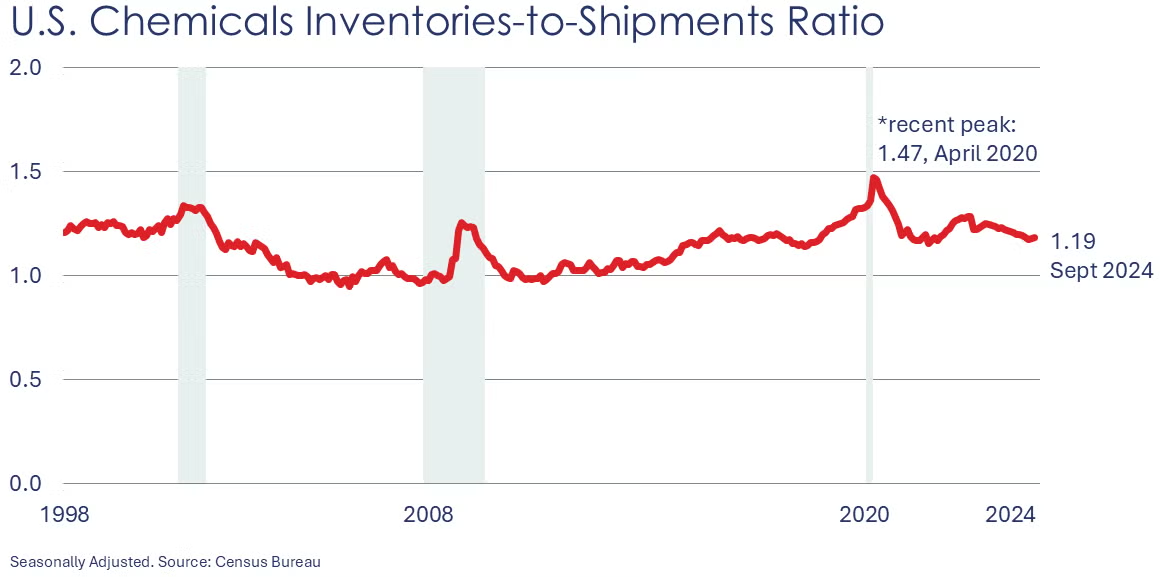
Chemical shipments declined by 0.2% in September to $54.3 billion as a gain in coatings and adhesives was offset by declines in agricultural chemicals and other chemicals. Chemical inventories increased by 0.2% as a decline in coatings and adhesives was offset by gains in agricultural chemicals and other chemicals. Shipments were up 3.3% Y/Y and inventories were off 0.2% Y/Y. The inventories-to-sales ratio edged up to 1.19, which was lower than last September’s ratio of 1.23.
Sales of chemicals at the wholesale level rose 1.5% in September following a 2.0% decline in August. Wholesale chemical inventories also rose by 0.8% (following a 0.2% gain in August). As a result, the inventories-to-sales ratio edged slightly lower to 1.17 (from 1.18 in August). Last September, the ratio stood at 1.19. Chemical wholesales sales were 3.2% lower Y/Y and inventories were off 4.6% Y/Y.

Chemical manufacturing activity improved modestly in the third quarter and remains on track for steady expansion into 2025 according to companies participating in ACC’s quarterly Chemical Manufacturing Economic Sentiment Index (ESI) survey. ACC’s index, based on companies’ assessment of their activity level overall (e.g., sales, production, output) moderated, losing momentum in Q3 as chemical manufacturers reported subdued demand in major customer markets. Most companies described major customer market demand as having either stabilized or deteriorated in Q3. The volume of new orders index fell in Q3, reflecting declines in foreign orders and solid but muted growth in domestic orders.
Chemical manufacturers continue to assess the global economic situation as deteriorating. They report economic conditions in the U.S. as improving. However, the ESI survey continues to show an increasing level of regulatory burden every quarter.
Note On the Color Codes
Banner colors reflect an assessment of the current conditions in the overall economy and the business chemistry of chemistry. For the overall economy we keep a running tab of 20 indicators. The banner color for the macroeconomic section is determined as follows:
Green – 13 or more positives
Yellow – between 8 and 12 positives
Red – 7 or fewer positives
There are fewer indicators available for the chemical industry. Our assessment on banner color largely relies upon how chemical industry production has changed over the most recent three months.
For More Information
ACC members can access additional data, economic analyses, presentations, outlooks, and weekly economic updates through ACCexchange: https://accexchange.sharepoint.com/Economics/SitePages/Home.aspx
In addition to this weekly report, ACC offers numerous other economic data that cover worldwide production, trade, shipments, inventories, price indices, energy, employment, investment, R&D, EH&S, financial performance measures, macroeconomic data, plus much more. To order, visit http://store.americanchemistry.com/.
Every effort has been made in the preparation of this weekly report to provide the best available information and analysis. However, neither the American Chemistry Council, nor any of its employees, agents or other assigns makes any warranty, expressed or implied, or assumes any liability or responsibility for any use, or the results of such use, of any information or data disclosed in this material.
Contact us at ACC_EconomicsDepartment@americanchemistry.com.


