MACROECONOMY & END-USE INDUSTRIES
Running tab of macro indicators: 11 out of 20

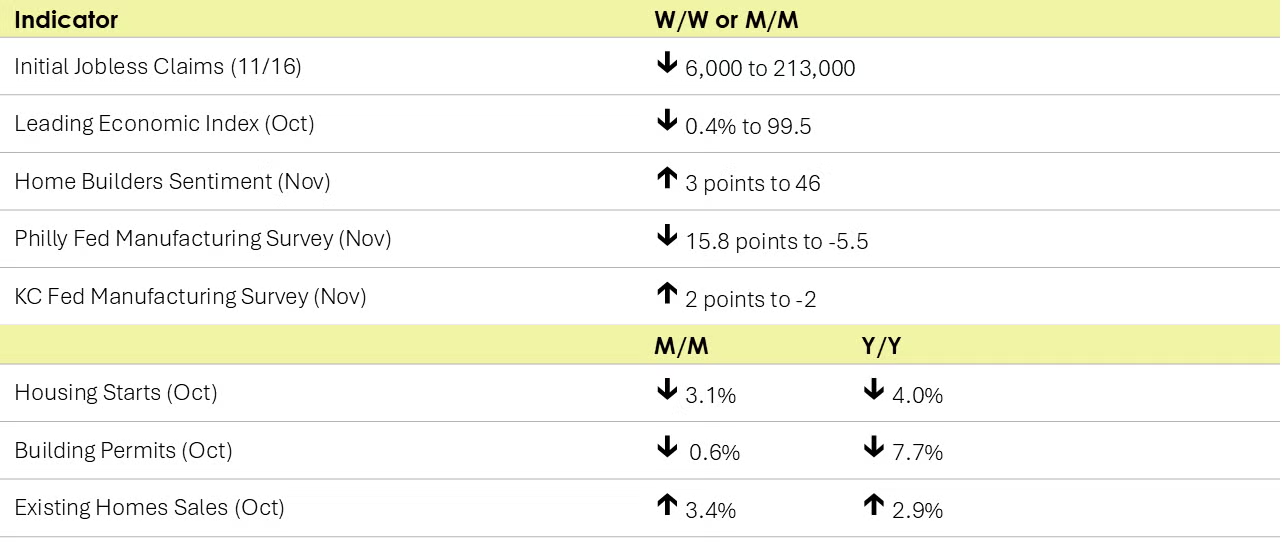
The number of new jobless claims fell by 6,000 to 213,000 during the week ending November 16. Continuing claims increased by 36,000 to 1.908 million, and the insured unemployment rate for the week ending November 9 was unchanged at 1.3%.
Homebuilder confidence rose three points to 46 in November with gains across all three components: current sales conditions, sales conditions six months ahead, and buyer traffic. It was the third consecutive gain; however, the index remains below 50, a threshold where a majority of homebuilders are confident about the current and near-term outlook for housing.
Housing starts slipped 3.1% in October with declines in the Northeast and the South (likely impacted to some degree by Hurricanes Helene and Milton). Single family starts were down 6.9%. Forward-looking building permits were also lower, by 0.6%. Compared to a year ago, housing starts were down 4.0% Y/Y while building permits were off 7.7% Y/Y. Despite recent interest rate reductions, affordability and comparatively high borrowing costs remain headwinds for housing.

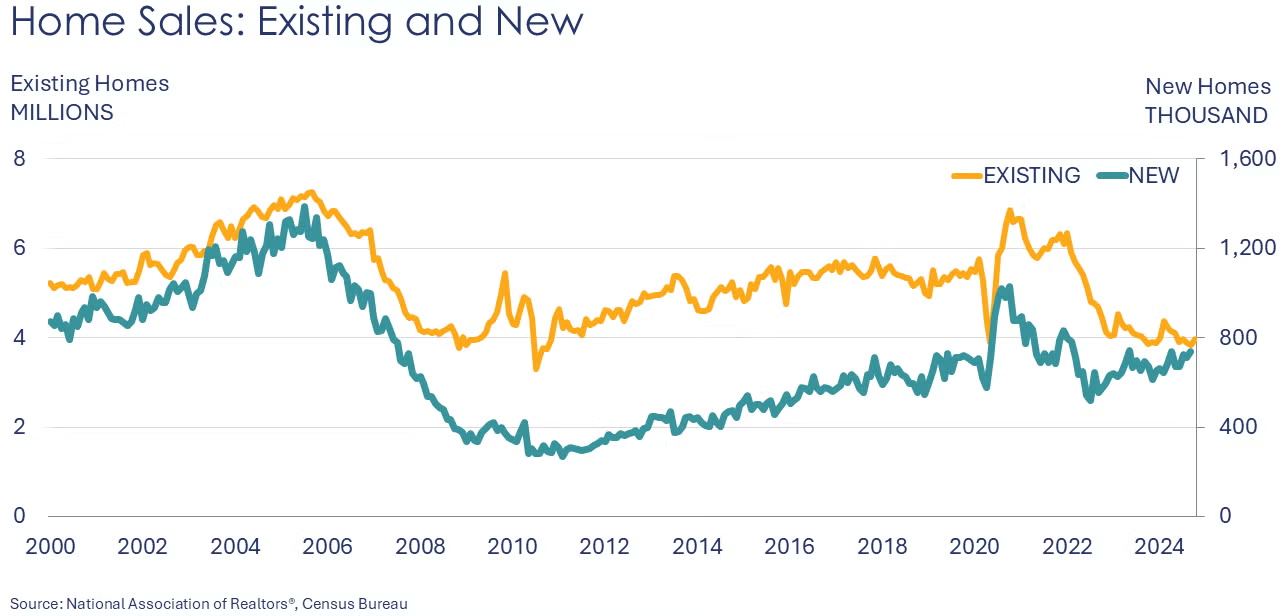
According to the National Association of Realtors® (NAR), existing home sales improved in all regions of the country in October. Sales rose by 3.4% to a seasonally adjusted annual rate of 3.96 million in October, a level up 1.8% Y/Y. The median existing-home price was 4.0% higher compared to last year. The inventory of existing homes for sale edged up to 1.37 million in October, the equivalent of 4.2 months’ supply. Mortgage rates remain elevated but have eased and are down notably from year ago.
Federal Reserve surveys of regional manufacturing activity released this week point to weakness in November. Manufacturing activity in the Philadelphia Fed’s region softened overall. General activity fell into contraction in November from expansion in October. Growth in new orders and shipments slowed but remained positive. Firms continued to report higher input prices and higher prices received. Manufacturers are expecting growth in activity over the coming six months. In the Kansas City Fed’s region, manufacturers reported factory activity contracted in November while expectations for future activity rose. Nondurable goods manufacturing declined modestly while durable goods activity was flat. New orders and production contracted.

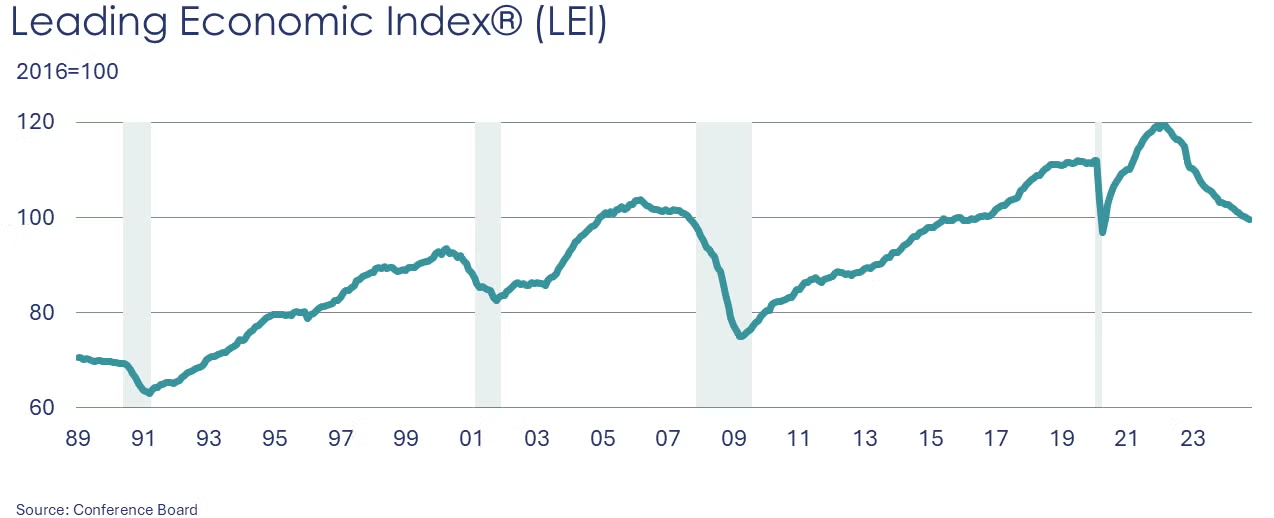
The Conference Board Leading Economic Index® (LEI) for the U.S. declined by 0.4% to 99.5 in October. Over the six-month period from April to October 2024, the LEI declined by 2.2% (an accelerated pace compared to 2.0% decline over the previous six months). The LEI signals weakness ahead.
ENERGY

Oil prices were higher than a week ago as rising concern over escalating tensions between Ukraine and Russia offset higher US commercial inventories.
U.S. natural gas prices surged to their highest levels since June on near-term forecasts for colder weather following an unusually warm autumn. Natural gas inventories posted their first draw of the season last week (3 BCF). Gas inventories were above the five-year historical average.
The combined oil and gas rig count fell by two to 579.
CHEMICALS
Indicators for the business of chemistry suggest a yellow banner.

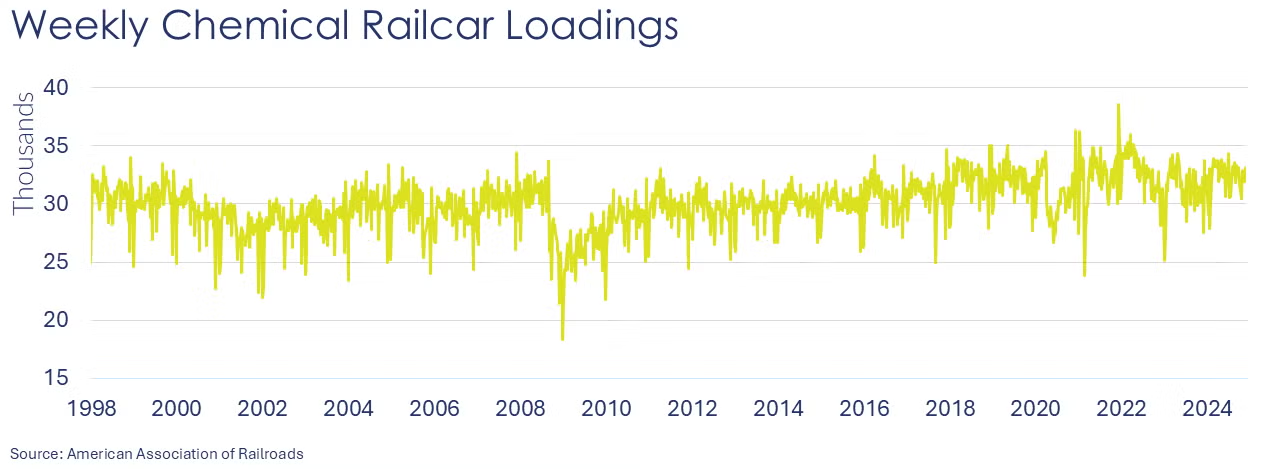
According to data released by the Association of American Railroads, chemical railcar loadings were up to 33,170 for the week ending 16 November. Loadings were up 3.7% Y/Y (13-week MA), up (4.0%) YTD/YTD and have been on the rise for five of the last 13 weeks.

Following a 0.6% loss in September, the U.S. CPRI declined again in October (-0.1%). The CPRI measures chemical production trends on a three-month moving average (3MMA) to smooth month-to-month volatility. Chemical production declined in all regions except for the Gulf region, where production increased. The U.S. CPRI is 0.2% higher than a year ago.

Note On the Color Codes
Banner colors reflect an assessment of the current conditions in the overall economy and the business chemistry of chemistry. For the overall economy we keep a running tab of 20 indicators. The banner color for the macroeconomic section is determined as follows:
Green – 13 or more positives
Yellow – between 8 and 12 positives
Red – 7 or fewer positives
There are fewer indicators available for the chemical industry. Our assessment on banner color largely relies upon how chemical industry production has changed over the most recent three months.
For More Information
ACC members can access additional data, economic analyses, presentations, outlooks, and weekly economic updates through ACCexchange: https://accexchange.sharepoint.com/Economics/SitePages/Home.aspx
In addition to this weekly report, ACC offers numerous other economic data that cover worldwide production, trade, shipments, inventories, price indices, energy, employment, investment, R&D, EH&S, financial performance measures, macroeconomic data, plus much more. To order, visit http://store.americanchemistry.com/.
Every effort has been made in the preparation of this weekly report to provide the best available information and analysis. However, neither the American Chemistry Council, nor any of its employees, agents or other assigns makes any warranty, expressed or implied, or assumes any liability or responsibility for any use, or the results of such use, of any information or data disclosed in this material.
Contact us at ACC_EconomicsDepartment@americanchemistry.com.

