MACROECONOMY & END-USE MARKETS
Running tab of macro indicators: 11 out of 20

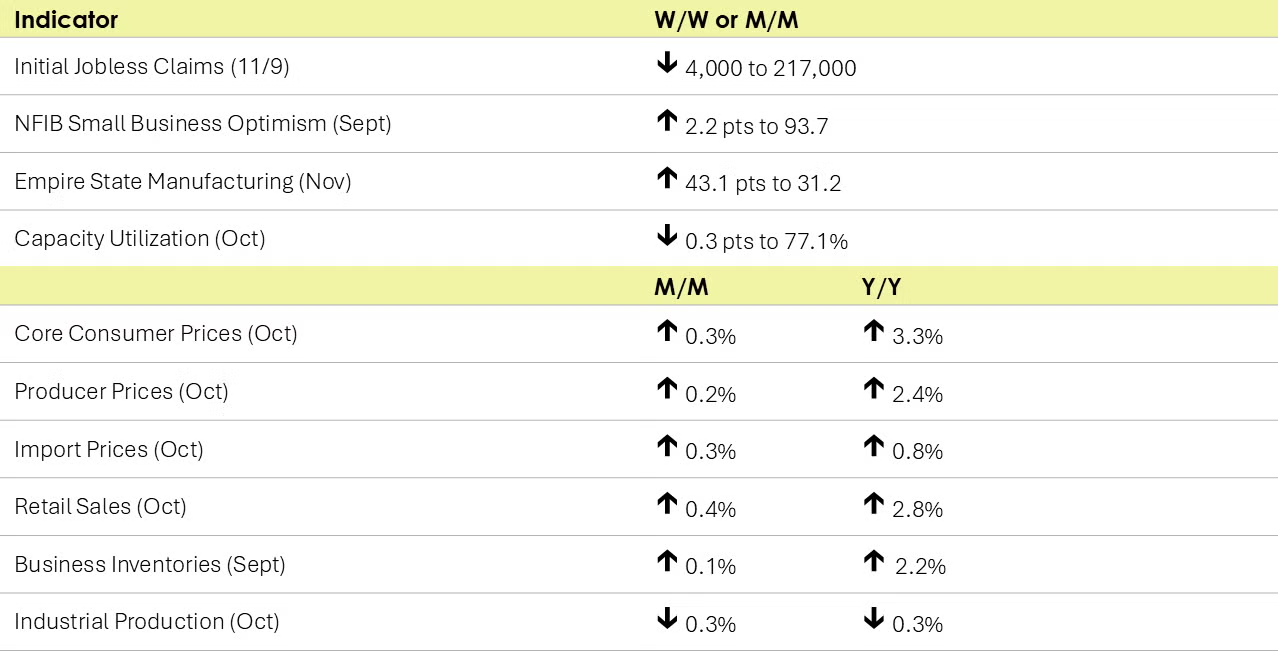
The number of new jobless claims fell by 4,000 to 217,000 to their lowest level in six months during the week ending November 9th. Continuing claims fell by 11,000 to 1.884 million, and the insured unemployment rate for the week ending November 2nd was unchanged at 1.2%.
Headline retail and food service sales rose 0.4% in October, a slower gain than in September. The largest gains in sales were at motor vehicle & parts dealers and electronics & appliance stores. Sales also rose at building material & garden centers and restaurants and bars. Compared to a year ago, retail and food service sales were up 2.8% Y/Y.

Headline consumer prices were up 0.2% in October and up 2.6% Y/Y, an acceleration from September’s 2.4% Y/Y gain (which was the lowest in the last 3½ years). Energy prices were flat, but food prices continued to rise. Excluding the volatile food and energy components, core CPI was up 0.3%. Compared to a year ago, core CPI was up 3.3%, the same annual pace as reported in September. The gain in core prices continues to be driven by higher prices for core services (including transportation and medical services, in addition to shelter). Core commodity prices were lower than a year ago.
Producer prices rose 0.2% in October and were up 2.4% Y/Y, an acceleration from September’s 1.9% Y/Y gain. Core producer prices were up by 0.3% and were up 3.5% Y/Y (also an acceleration from September). Prices for final demand goods edged higher, following two months of declines. Prices for services continued to rise, driven by higher prices for transportation and warehousing, portfolio management, and machinery and vehicle wholesaling.
Import prices rose 0.3% in October, following declines in August and September. Higher prices for imported fuels led the gain. Prices for nonfuel imports rose by 0.2% and were up 2.3% Y/Y, the largest Y/Y gain in two years. Export prices also rose, by 0.8% with prices for agricultural exports continuing to advance. Prices for nonagricultural exports rose 0.6%. Compared to a year ago, import prices were up 0.8% while export prices were off slightly, by 0.1%.
Combined business inventories edged slightly higher in September (up 0.1%). There were gains across all three major categories, with the largest gains in retail inventories. Business sales rose 0.3% as higher sales at retailers and wholesalers offset lower sales at manufacturers. Compared to a year ago, business inventories were up 2.2% Y/Y while sales were higher by 0.5% Y/Y. The inventories-to-sales ratio remained steady from August at 1.38. A year ago, the ratio was 1.35.
Small business optimism rose 2.2 percentage points to 93.7 in October, the 34th month the index has been below its 50-year average of 98. A net negative 20% of all owners (seasonally adjusted) reported higher nominal sales in the past three months, the lowest reading since July 2020. Inflation remains the top issue, with 23% of owners reporting that inflation was their single most important problem in operating their businesses. NFIB commented that “Although optimism is on the rise on Main Street, small business owners are still facing unprecedented economic adversity. Low sales, unfilled jobs openings, and ongoing inflationary pressures continue to challenge our Main Streets, but owners remain hopeful as they head toward the holiday season.”

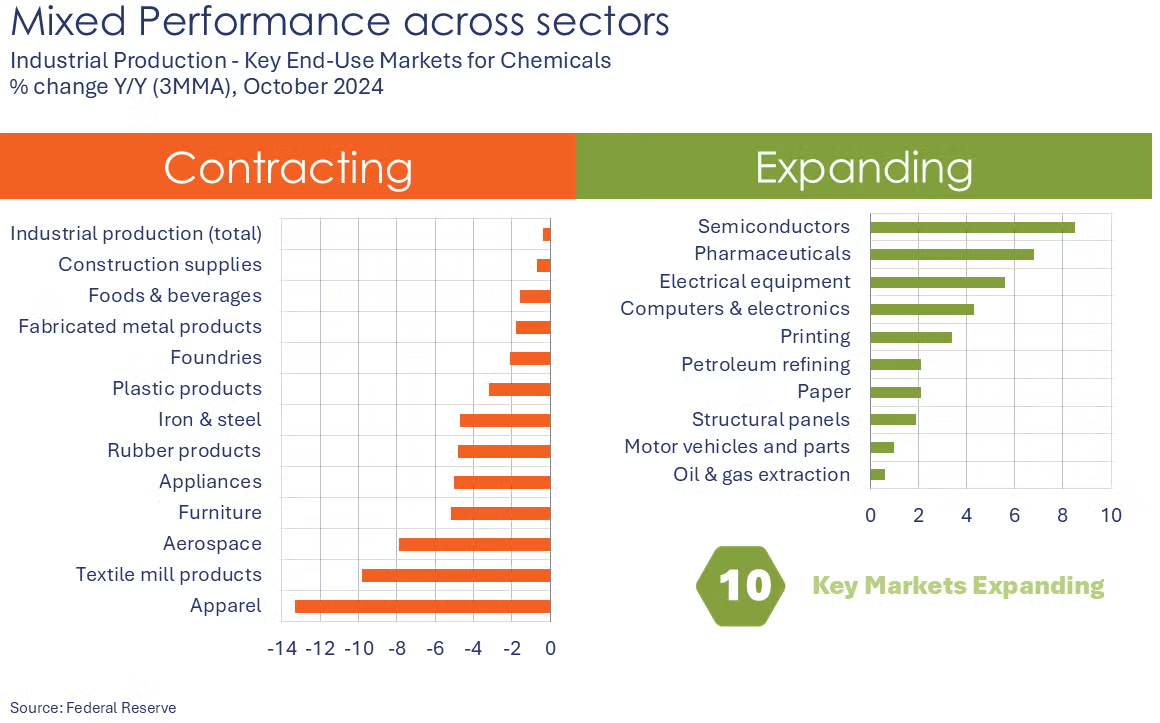
Following a 0.5% decline in September, industrial production continued to slide in October, down by 0.3%. Utility and mining output expanded, but manufacturing output fell 0.5%, reflecting the impact of Hurricanes Helene and Milton and the Boeing strike. Within manufacturing, the largest declines were in aerospace, motor vehicles, primary metals, furniture, printing, and plastic & rubber products. Output in several sectors increased, including nonmetallic mineral products, computers & electronics, paper, petroleum products, and chemicals (including pharmaceuticals). Compared to a year ago, industrial production was off by 0.3% Y/Y.
Capacity utilization eased by 0.3 percentage points to 77.1% in October. A year ago, capacity utilization was 78.3%. Overall industrial capacity was 1.2% higher than last October.
Manufacturing activity rose strongly in New York State in November. The headline general business conditions index shot up 43 points to 31.2, its highest reading in nearly three years. New orders, shipments, and inventories expanded. Firms remained optimistic that conditions would continue to improve in the months ahead with the future business activity index coming in at 33.2 (slightly lower than September’s reading). A reading above 0 indicates higher activity.
ENERGY

- Oil prices were lower than a week ago due to a higher dollar and a revised IEA forecast showing a glut in 2025.
- U.S. natural gas prices were slightly higher than a week ago on forecasts for colder weather. Price gains were partially offset by another late-season inventory build.
- Gas prices in Europe jumped to their highest levels this year (€45.9/MWh or $14.23/mmbtu) on concerns over a potential supply disruption from Russia.
- The combined oil and gas rig count remained stable for a third week at 581.
CHEMICALS
Indicators for the business of chemistry suggest a yellow banner.

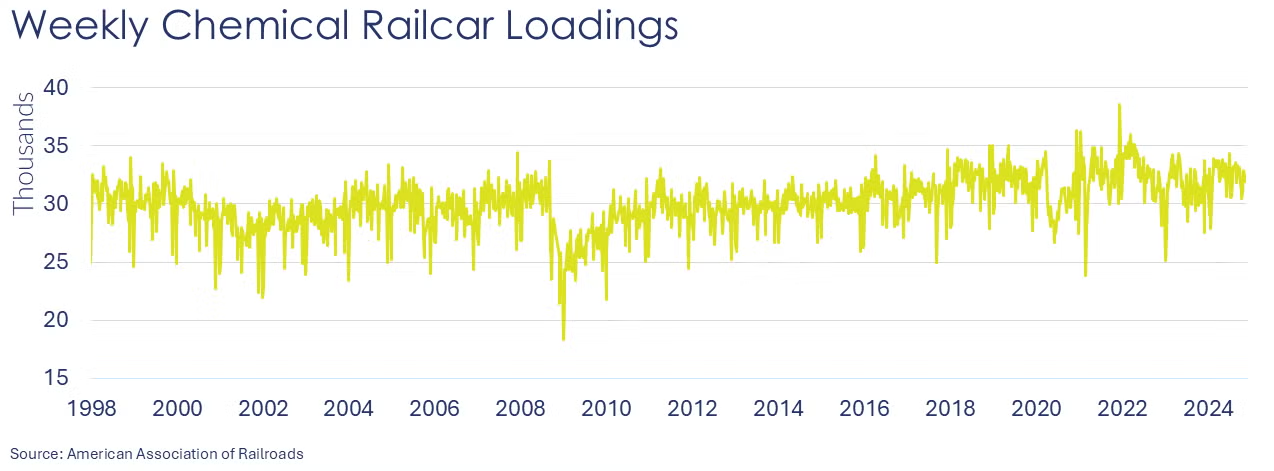
According to data released by the Association of American Railroads, chemical railcar loadings were down to 31,935 for the week ending November 9th. Loadings were up 3.4% Y/Y (13-week MA), up (4.0%) YTD/YTD and have been on the rise for five of the last 13 weeks.

Chemical producer prices rose 0.8% in October, following declines in August and September. Prices for plastic resins, synthetic rubber, manufactured fibers, and agricultural products were higher. Those gains were offset by lower prices for inorganic chemicals, bulk petrochemicals & organics, and other specialty chemicals. Prices for consumer products and coatings were flat. Compared to a year ago, chemical prices were flat.
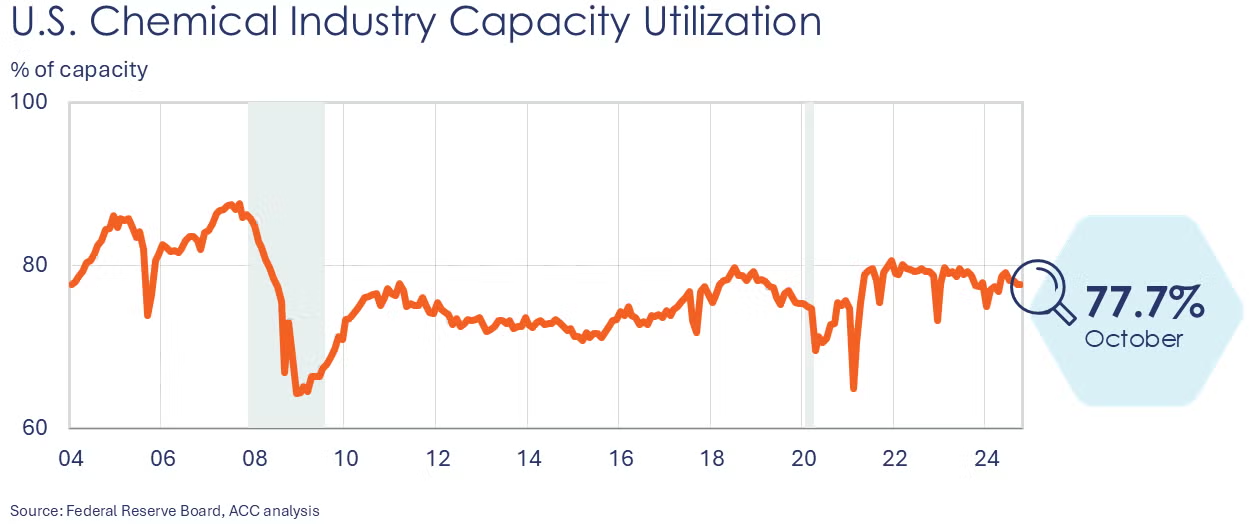
Chemical production edged higher by 0.2% in October, following a 0.5% decline in September. Compared to a year ago, chemical production was up 1.3% Y/Y. Output was higher for synthetic rubber, manufactured fibers, resins, agricultural chemicals, coatings, other specialty chemicals and consumer products. Those gains were partially offset by lower production of basic organic and inorganic chemicals. Chemical industry capacity utilization rose from 77.6% in September to 77.7% in October.

Prices for imported chemicals fell 0.2% in October following gains in August and September. Prices for chemical exports also fell 0.2%, the first monthly decline in export prices since May. Compared to a year ago, import prices were down 1.3% Y/Y while export prices were higher by 1.0% Y/Y.
Note On the Color Codes
Banner colors reflect an assessment of the current conditions in the overall economy and the business chemistry of chemistry. For the overall economy we keep a running tab of 20 indicators. The banner color for the macroeconomic section is determined as follows:
Green – 13 or more positives
Yellow – between 8 and 12 positives
Red – 7 or fewer positives
There are fewer indicators available for the chemical industry. Our assessment on banner color largely relies upon how chemical industry production has changed over the most recent three months.
For More Information
ACC members can access additional data, economic analyses, presentations, outlooks, and weekly economic updates through ACCexchange: https://accexchange.sharepoint.com/Economics/SitePages/Home.aspx
In addition to this weekly report, ACC offers numerous other economic data that cover worldwide production, trade, shipments, inventories, price indices, energy, employment, investment, R&D, EH&S, financial performance measures, macroeconomic data, plus much more. To order, visit http://store.americanchemistry.com/.
Every effort has been made in the preparation of this weekly report to provide the best available information and analysis. However, neither the American Chemistry Council, nor any of its employees, agents or other assigns makes any warranty, expressed or implied, or assumes any liability or responsibility for any use, or the results of such use, of any information or data disclosed in this material.
Contact us at ACC_EconomicsDepartment@americanchemistry.com.


