MACROECONOMY & END-USE MARKETS
Running tab of macro indicators: 10 out of 20
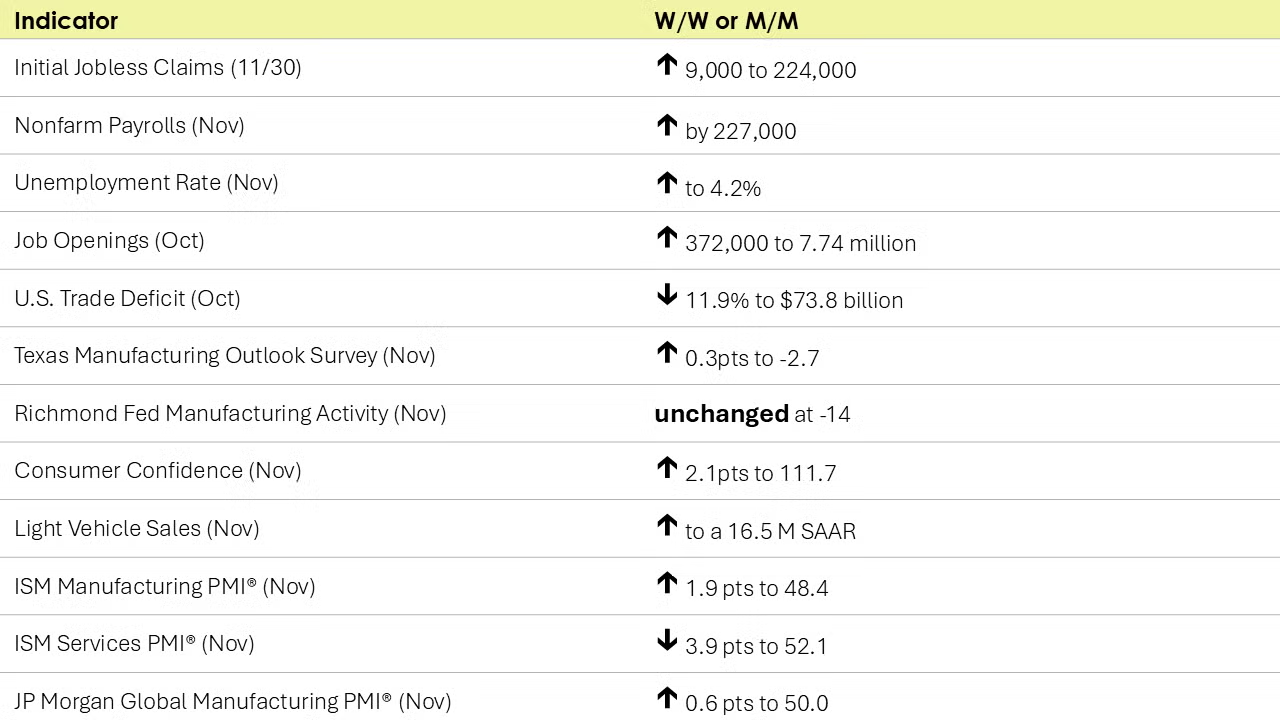
Nonfarm payrolls rose by 227,000 in November, a little better than expected, and better than October’s revised 36,000 (which was distorted by the Boeing strike and two hurricanes). As in previous months, most of the gains were driven by gains in services. Manufacturing jobs rose in November, but the gain represented just a little over a third of the cumulative decline in September and October. Average hourly earnings rose by 4.0% Y/Y. According to the separate household survey, employment continued to fall and the number of unemployed rose for a second month. The unemployment rate edged higher from 4.1% in October to 4.2% in November. The civilian labor force continued to shrink for a second month and the labor force participation rate moved lower.
The number of new jobless claims rose by 9,000 to 224,000 during the week ending November 30. Continuing claims fell by 25,000 to 1.87 million, and the insured unemployment rate for the week ending November 23 was down to 1.2%.
Following a decline in September job openings rose by 372,000 (or 5.0%) to 7.74 million in October. Balanced against the number of unemployed people, there were 1.1 jobs available for each unemployed person for a fourth consecutive month. The number of voluntary quits (a measure of workers’ willingness or ability to leave a job) rose by 228,000 to 3.3 million. The number of hires eased, however.
The nation's international trade deficit in goods and services decreased 11.9% to $73.8 billion in October from $83.8 billion in September (revised), as imports decreased more than exports. Goods exports declined in capital goods (including computer accessories), cars and other vehicles, industrial supplies and materials, and consumer goods. Goods imports fell in capital goods (including computers and semiconductors), industrial supplies and materials (including crude oil), consumer goods, autos and parts.
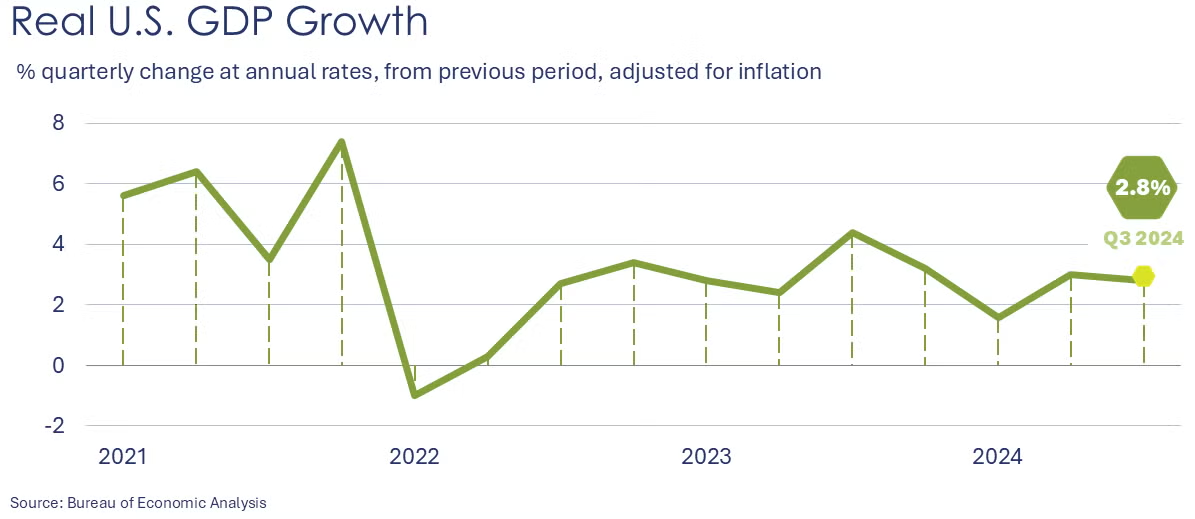
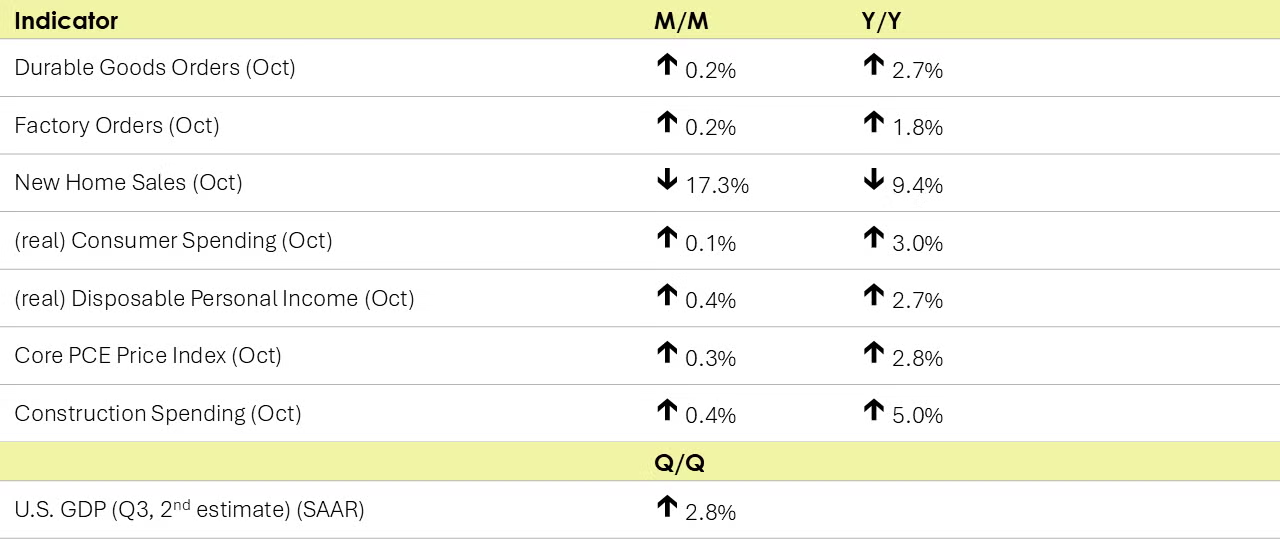
Real gross domestic product (GDP) increased at an annual rate of 2.8% in the third quarter of 2024, according to the BEA’s “second” estimate. In the second quarter, real GDP increased 3.0%. The increase in the third quarter primarily reflected increases in consumer spending, exports, federal government spending, and business investment. Imports, which are a subtraction in the calculation of GDP, increased.
Consumer spending (aka personal consumption expenditures or PCE) rose in October, up by 0.4% following 0.6% growth in September. After accounting for inflation, real consumer spending was up 0.1% (nearly flat). Consumer spending on services increased in October while spending on goods declined. Aggregate disposable personal income rose 0.7% (up 0.4% after adjusting for inflation) reflecting gains in employee compensation. Growth in the PCE price index accelerated to 2.3% Y/Y (up from 2.1% Y/Y in September) while growth in the Fed-preferred inflation measure, the core PCE price index, accelerated to 2.8% Y/Y.
The Conference Board’s Consumer Confidence Index® improved in November. Consumers are more optimistic about the current situation and the short-term outlook for income, business, and labor conditions. Consumers reported improved sentiment on future job availability. Expectations about inflation improved but remain a top concern. Consumers’ assessment of their family’s finances over the next six reached a high and hopes of paying off debt, saving more money, and paying lower taxes made the consumer “wish list for 2025”.
Light vehicle sales rose to a 16.5 million seasonally adjusted annual rate in November, the fastest pace since May 2021. The gain was driven by light-duty trucks (including minivans and SUVs). Sales of passenger automobiles declined.
New home sales dropped 17.3% in October to a seasonally adjusted annual rate (SAAR) of 610k, a pace down 9.4% Y/Y. The October drop largely reflects lower sales in the South. At the end of October, new homes for sale had pushed up to 481k, representing a supply of 9.5 months at the current sales rate and the highest recording in more than 2 years. The median sales price of new houses sold in October 2024 rose to $437,300.
Construction spending rose 0.4% in October with gains in privately-funded residential projects offsetting declines in nonresidential (both privately- and publicly-funded). Following several years of strong gains, manufacturing construction spending was essentially flat for a second consecutive month. Construction spending was up 5.0% Y/Y.
New orders placed with U.S. factories for durable goods held steady (+0.2%) over October following two months of decline and were up 2.7% Y/Y. Core capital goods orders (non-defense capital goods orders excluding aircraft), a proxy for business investment in long-lasting equipment, declined 0.2% in October but remained 0.6% higher Y/Y. Orders were higher for both defense and civilian aircraft. Orders also rose for machinery, metal products, communications equipment, and electronics categories. Orders were lower for autos and parts, primary metals, and computers.
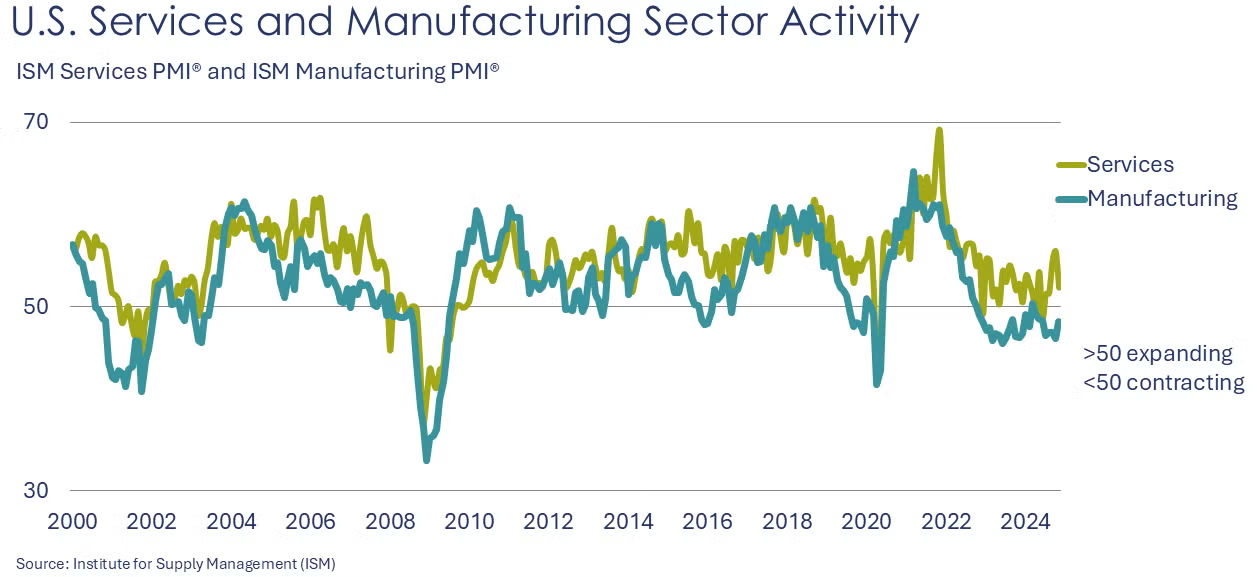
The ISM Services PMI® came in above 50 (suggesting expansion) for the 51st time in 54 months since recovery from the COVID pandemic-induced recession began in June 2020. The reading for November was 52.1%, down 3.9 points from 56.0 in October. The moderation in the index reflects declines in business activity, new orders, employment and supplier deliveries. Overall, the message is sustained growth in the services sector.
The ISM Manufacturing PMI® moved closer to stable in November, up 1.9 points to 48.4. The reading suggests that US manufacturing contracted for the eighth consecutive month (and for the 24th of the past 25 months). Only three manufacturing industries reported growth and 11 reported contraction. New orders expanded very slightly, but production, employment, order backlogs, inventories, export orders, and imports continued to contract. Supplier deliveries, a measure of how much slack is in the transportation and logistics system, were faster in November.
The JP Morgan Global Manufacturing PMI® rose 0.6 points to 50.0 in November, the neutral threshold. Improved business conditions in China and the rest of Asia offset further deterioration in the Eurozone. New orders and production expanded while export orders and employment declined.
The Chicago Business Barometer™ eased 1.4 points to 40.2 in November indicating contraction in Chicago area business activity. New orders rose in November, but contraction was reported in production, order backlogs, employment and supplier deliveries.
Texas manufacturing activity was flat in November according to findings from the Dallas Fed survey. Growth in production was flat while new orders contracted further signaling weakness ahead. Manufacturers’ outlook and expectations for activity six months from now improved, however, and companies reported reduced uncertainty. Manufacturing activity in the Richmond Fed district remained depressed. Overall activity contracted as did shipments, new orders, and employment levels. Manufacturers are optimistic about growth in shipments and new orders over the coming six months. Local business conditions were reported as weak but are expected to improve soon.
U.S. factory orders rose 0.2% in October following a 0.2% decline in September. Orders are up 0.4% YTD/YTD. New orders for core business goods (nondefense capital goods excluding aircraft) fell by 0.2%. Unfilled orders (a measure of the manufacturing pipeline) rose 0.4%. Manufacturers’ shipments declined 0.2% and inventories declined by 0.1%. The inventories-to-shipments ratio was 1.46, unchanged from September.
FED BEIGE BOOK
- Economic activity rose slightly in most Districts. Three regions exhibited modest or moderate growth that offset flat or slightly declining activity in two others. Though growth in economic activity was generally small, expectations for growth rose moderately across most geographies and sectors. Business contacts expressed optimism that demand will rise in coming months.
- Consumer spending was generally stable. Many consumer-oriented businesses across Districts noted further increases in price sensitivity among consumers, as well as several reports of increased sensitivity to quality. Spending on home furnishings was down, which contacts attributed to limited household mobility.
- Demand for mortgages was low overall, though reports on recent changes in home loan demand were mixed due to volatility in rates. Commercial real estate lending was similarly subdued. Still, contacts generally reported financing remained available.
- Capital spending and purchases of raw materials were flat or declining in most Districts. Sales of farm equipment were a notable headwind to overall investment activity, and several contacts expressed concerns about the future prices of equipment given ongoing weakness in the farm economy.
- Energy activity in the oil and gas sector was flat but demand for electricity generation continued to grow at a robust rate. The rise in electricity demand was driven by rapid expansions in data centers and was reportedly planned to be met by investments in renewable generation capacity in coming years.
ENERGY

Oil prices were lower than a week ago, despite the OPEC+ decision to further delay production increases until April due to a lackluster demand outlook. U.S. natural gas prices also eased last week. Gas inventories remain above their five-year historical maximum going into the heating season. The combined oil and gas rig count eased by one to 577.
CHEMICALS
Indicators for the business of chemistry suggest a yellow banner.
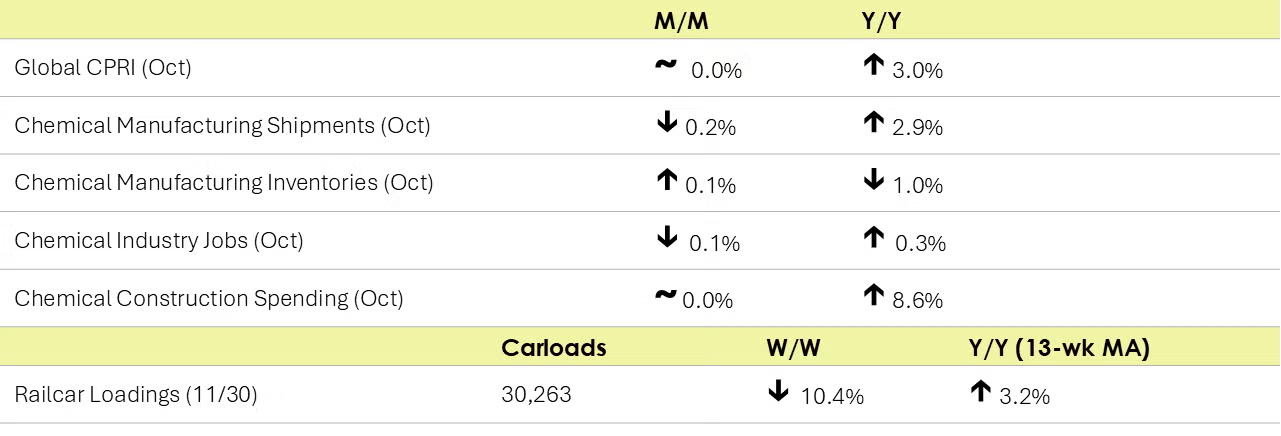
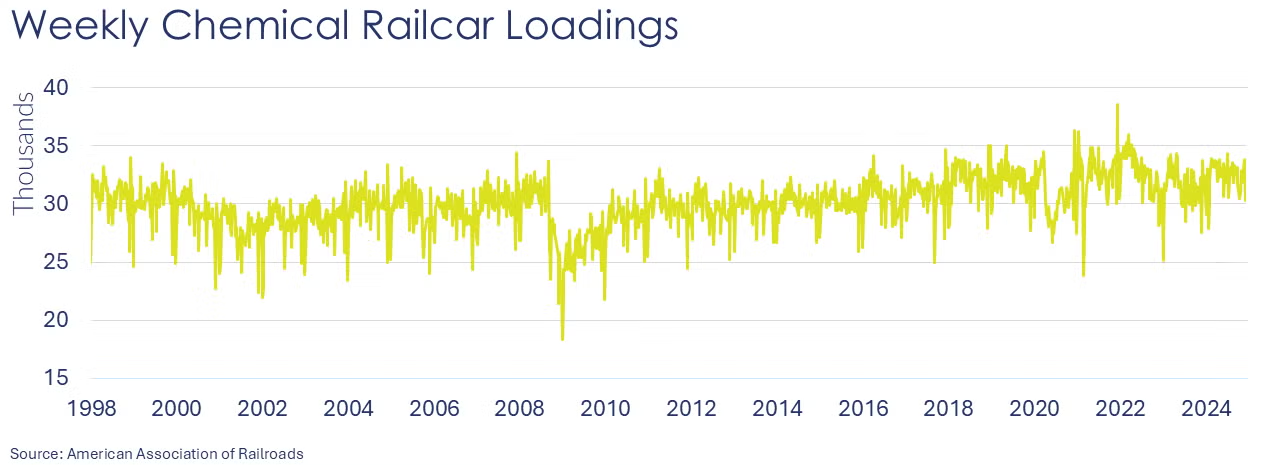
According to data released by the Association of American Railroads, chemical railcar loadings were down to 30,263 for the week ending November 30. Loadings were up 3.2% Y/Y (13-week MA), up (4.0%) YTD/YTD and have been on the rise for 5 of the last 13 weeks.
Within the details of the ISM Manufacturing PMI® report, the chemical industry was reported to have been in contraction. The sub-components for new orders, production, employment, inventories, order backlogs, new export orders and imports indicated declines. Customer inventories were deemed to be “too low”. One respondent noted, “High mortgage rates continue to hamper demand for new housing construction, which is a key market for adhesives and sealants.”
- Comments from chemical manufacturers from the Texas Manufacturing Outlook Survey:
“Global industrial demand for chemicals remains stable but at low levels. Our outlook six months forward is for very slow improvement, but that outlook is uncertain due to risks of tariffs and the potential impact on global demand. Rising long-term rates remain a headwind for domestic construction activity and the resulting sluggish demand for PVC as construction material.” - “Short-term…the continuing decline in economic demand related to the automotive industry and building trades has created a large reduction in orders/volume. Longer term, the outcome of the election should benefit all U.S. businesses once policy is corrected, and consumer confidence increases.”
Chemical industry construction spending was flat in October at a $38.5 billion seasonally adjusted annual rate. Compared to last October, spending on chemical industry construction projects was up 8.6% Y/Y.
Following weakness in September (0%), ACC’s Global Chemical Production Regional Index (Global CPRI) remained muted (0%) in October. Production in Asia, South America, Africa & the Middle East, and the former Soviet Union increased while output North America and Europe declined. Production in China continued to trend upward, but the momentum slowed. The rebound in German output stalled as the manufacturing sector struggled to find footing. On a segment basis, strength in agricultural and specialty chemicals offset weakness in basic and consumer chemicals. Global chemical production growth was up 3.0% Y/Y.
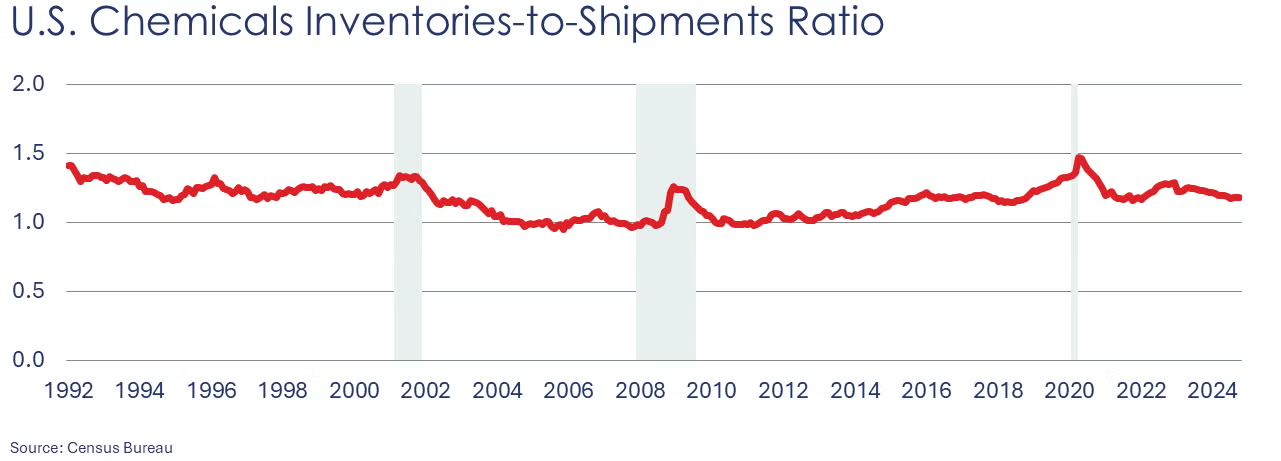
Chemical shipments declined by 0.2% in October to $54.2 billion as shipments of coatings and adhesives and agricultural chemicals declined. Chemical inventories increased by 0.1% as inventories increased in coatings and adhesives and agricultural chemicals. Shipments were up 2.9% Y/Y and inventories were off 1.0% Y/Y. The inventories-to-sales ratio held steady at 1.18, which was lower than last October’s ratio of 1.23.
Chemical industry employment fell slightly in October, down 0.1% to 557,900, a level up 0.3% Y/Y. Employment in plastic resin manufacturing was slightly higher, however, up by 0.3% to 61,600. Resin manufacturing was 1.9% lower than a year ago, however. (Note that data at the detailed industry level are lagged one month behind the headline jobs report.)
In November, chemical and pharmaceutical industry employment rose 0.1% to 902,500. Average hourly earnings rose by 1.6% Y/Y, the slowest pace in more than two years. Average weekly hours fell by 12 minutes to 40.9 hours. Production jobs rose while supervisory and non-production workers declined. The total labor input into chemical and pharmaceutical manufacturing was essentially flat, in contrast to the ISM Manufacturing PMI report.
Note On the Color Codes
Banner colors reflect an assessment of the current conditions in the overall economy and the business chemistry of chemistry. For the overall economy we keep a running tab of 20 indicators. The banner color for the macroeconomic section is determined as follows:
Green – 13 or more positives
Yellow – between 8 and 12 positives
Red – 7 or fewer positives
There are fewer indicators available for the chemical industry. Our assessment on banner color largely relies upon how chemical industry production has changed over the most recent three months.
For More Information
ACC members can access additional data, economic analyses, presentations, outlooks, and weekly economic updates through ACCexchange: https://accexchange.sharepoint.com/Economics/SitePages/Home.aspx
In addition to this weekly report, ACC offers numerous other economic data that cover worldwide production, trade, shipments, inventories, price indices, energy, employment, investment, R&D, EH&S, financial performance measures, macroeconomic data, plus much more. To order, visit http://store.americanchemistry.com/.
Every effort has been made in the preparation of this weekly report to provide the best available information and analysis. However, neither the American Chemistry Council, nor any of its employees, agents or other assigns makes any warranty, expressed or implied, or assumes any liability or responsibility for any use, or the results of such use, of any information or data disclosed in this material.
Contact us at ACC_EconomicsDepartment@americanchemistry.com.
