MACROECONOMY & END-USE MARKETS
Running tab of macro indicators: 10 out of 20
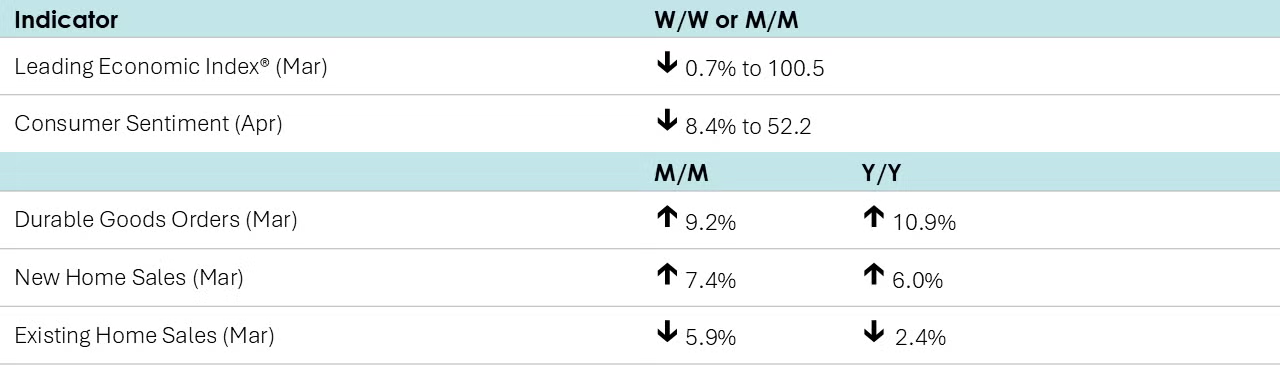
One of the first pieces of data that reflects the world after April 2nd, the University of Michigan’s final Index of Consumer Sentiment tumbled 8.4% in April to 52.2, the fourth consecutive monthly decline. While the index declined compared to March, it came in higher than its preliminary estimate for April released two weeks ago. The Index of Consumer Expectations continued to decline steeply. Since January, consumer expectations have fallen by 32%, the steepest three-month percentage decline since the 1990 recession. Year-ahead inflation expectations surged from 5.0% in March to 6.5% in April, the highest reading since 1981.
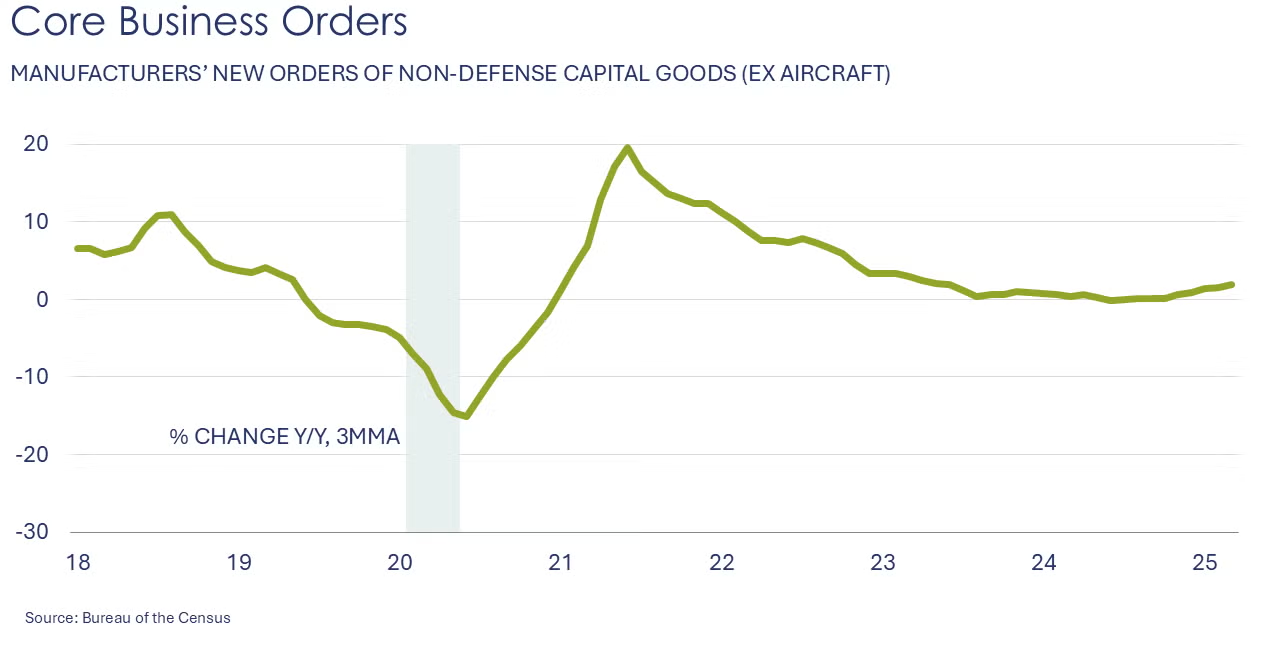
Headline durable goods orders surged 9.2% in March, ahead of April’s tariff announcement. The gain was led by a sharp increase in orders for transportation equipment (civilian aircraft and motor vehicles). Core business goods orders (nondefense capital goods excluding aircraft) ticked slightly higher by 0.1% after easing by 0.3% in February. Compared to a year ago, headline orders were up 10.9% Y/Y while core orders were ahead by 1.8% Y/Y.
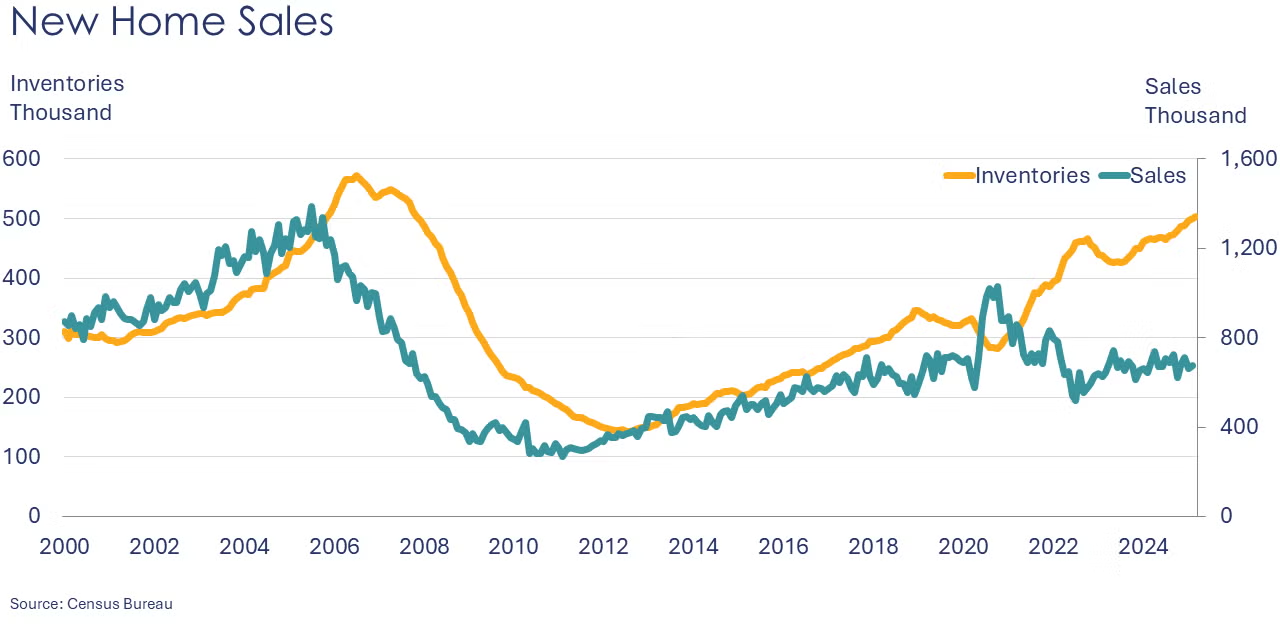
New home sales rose for a second month in March, up by a better-than-expected 7.4%. Inventories continued to advance, hitting a 15-year high. Sales grew in the South and Midwest, but were lower in the Northeast and West regions. At the current sales pace, inventories represent an 8.3-month supply, down from an 8.9-month supply in February. Compared to a year ago, new home sales were up 6.0% Y/Y while inventories were up 7.9% Y/Y. The median selling price was 7.5% lower compared to last March.
Existing home sales, which are a key driver of economic activity associated with remodeling and redecorating, fell by 5.9% in March to their slowest pace since 2009. The inventory of unsold homes continued to expand, up 8.1% from February, the equivalent of a 4.0-month supply at the current sales pace. The median sales price for existing homes sold in March was up 2.7% Y/Y to $403,700.
The Conference Board’s Leading Economic Index® (LEI) fell in March, down by 0.7%. Over the past six months, the LEI was down by 1.2%. The decline in March was led by lower consumer expectations, lower stock market valuations, and weak manufacturing orders.
Fed Beige Book
Published two weeks in advance of each FOMC (Federal Open Market Committee) meeting, the Beige Book presents a summary of recent economic conditions around the twelve Federal Reserve districts:
- Economic activity was little changed since the previous report, but uncertainty around international trade policy was pervasive across reports.
- Just five Districts saw slight growth, three Districts noted activity was relatively unchanged, and the remaining four Districts reported slight to modest declines.
- Non-auto consumer spending was lower overall; however, most Districts saw moderate to robust sales of vehicles and of some nondurables, generally attributed to a rush to purchase ahead of tariff-related price increases.
- Both leisure and business travel were down, on balance, and several Districts noted a decline in international visitors.
- Home sales rose somewhat, and many Districts continued to note low inventory levels. Commercial real estate (CRE) activity expanded slightly as multifamily propped up the industrial and office sectors. Loan demand was flat to modestly higher, on net.
- Transportation activity expanded modestly on balance.
- Manufacturing was mixed, but two-thirds of Districts said activity was little changed or had declined.
- The energy sector experienced modest growth. Agricultural conditions were fairly stable across multiple Districts.
- Cuts to federal grants and subsidies along with declines in philanthropic donations caused gaps in services provided by many community organizations.
- The outlook in several Districts worsened considerably as economic uncertainty, particularly surrounding tariffs, rose.
In its semiannual World Economic Outlook, the International Monetary Fund (IMF) downgraded its forecast for global economic growth for 2025 and 2026 citing recent tariff actions. Global growth is projected to drop to 2.8% in 2025 and 3.0% in 2026 (down from 3.3% for both years). Growth in the U.S. economy is expected to slow to 1.8% in 2025 (down from 2.7%) reflecting “greater policy uncertainty, trade tensions, and softer demand momentum.”
ENERGY
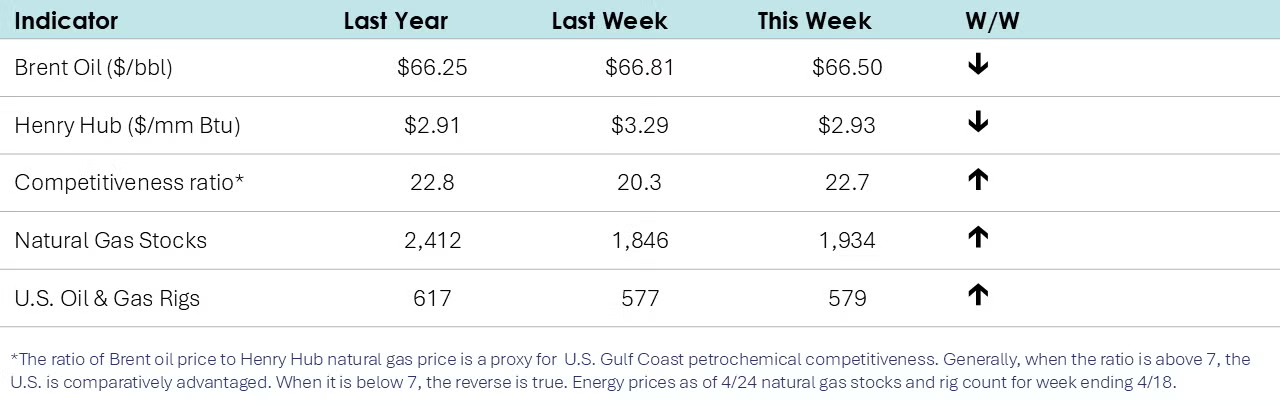
- Oil prices were lower than a week ago as OPEC+ may be considering accelerating oil output increases as Kazakhstan said it would continue to produce above target.
- U.S. natural gas prices were also lower (below $3/mmbtu) as the shoulder season (between heating and cooling) has dampened demand.
- The combined oil & gas rig count rose by two to 579.
CHEMICALS
Indicators for the business of chemistry suggest a yellow banner.

It was a slow week for chemical indicators, but there was a mention in the Fed’s Beige Book. In the Sixth District (Atlanta), “energy contacts expressed concern over tariffs on imported crude oil and refined petroleum products, as well as equipment and parts used for chemical plant construction.”
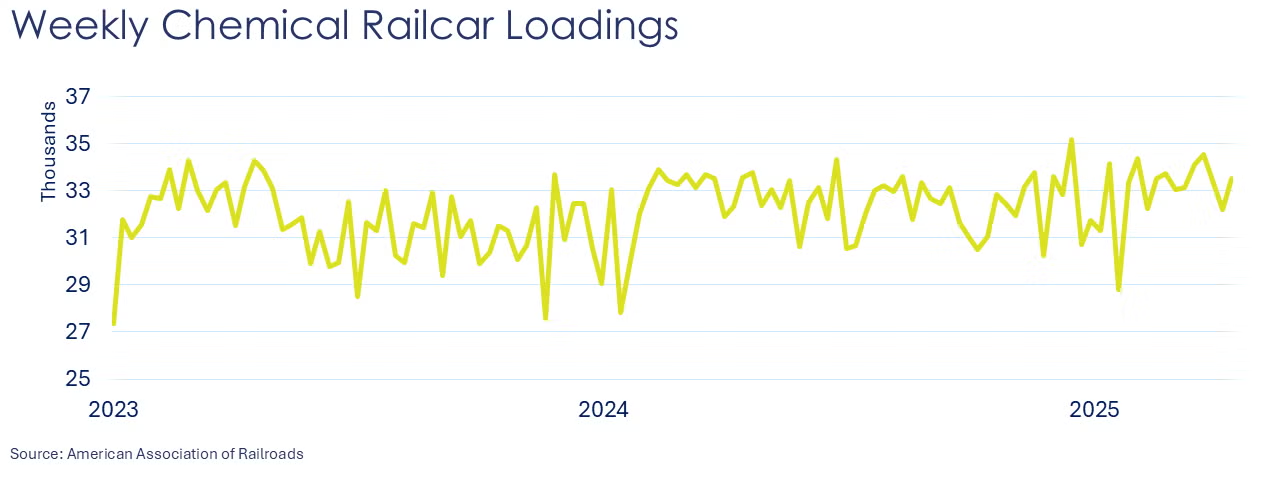
According to data released by the Association of American Railroads, chemical railcar loadings were up to 33,520 for the week ending 19 April. Loadings were up 2.7% Y/Y (13-week MA), up (1.8%) YTD/YTD and have been on the rise for eight of the last 13 weeks.
Note On the Color Codes
Banner colors reflect an assessment of the current conditions in the overall economy and the business chemistry of chemistry. For the overall economy we keep a running tab of 20 indicators. The banner color for the macroeconomic section is determined as follows:
Green – 13 or more positives
Yellow – between 8 and 12 positives
Red – 7 or fewer positives
There are fewer indicators available for the chemical industry. Our assessment on banner color largely relies upon how chemical industry production has changed over the most recent three months.
For More Information
ACC members can access additional data, economic analyses, presentations, outlooks, and weekly economic updates through ACCexchange.
In addition to this weekly report, ACC offers numerous other economic data that cover worldwide production, trade, shipments, inventories, price indices, energy, employment, investment, R&D, EH&S, financial performance measures, macroeconomic data, plus much more. To order, visit the ACC Store.
Every effort has been made in the preparation of this weekly report to provide the best available information and analysis. However, neither the American Chemistry Council, nor any of its employees, agents or other assigns makes any warranty, expressed or implied, or assumes any liability or responsibility for any use, or the results of such use, of any information or data disclosed in this material.
Contact ACC's Economics & Data Analytics department.

