MACROECONOMY & END-USE MARKETS
Running tab of macro indicators: 9 out of 20
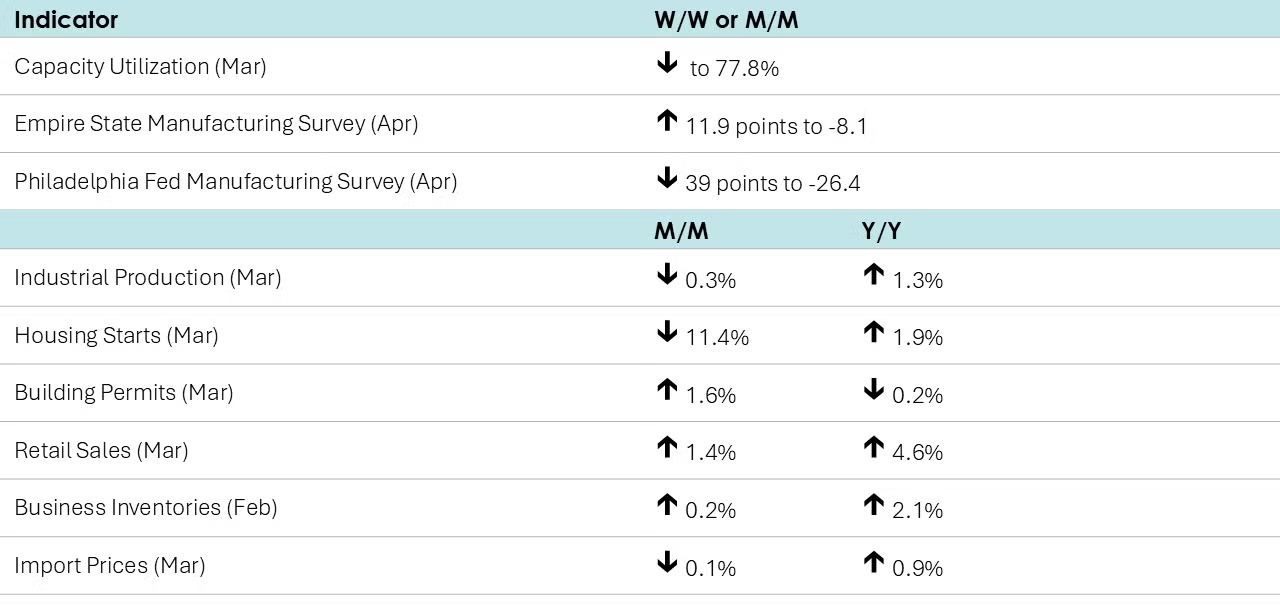
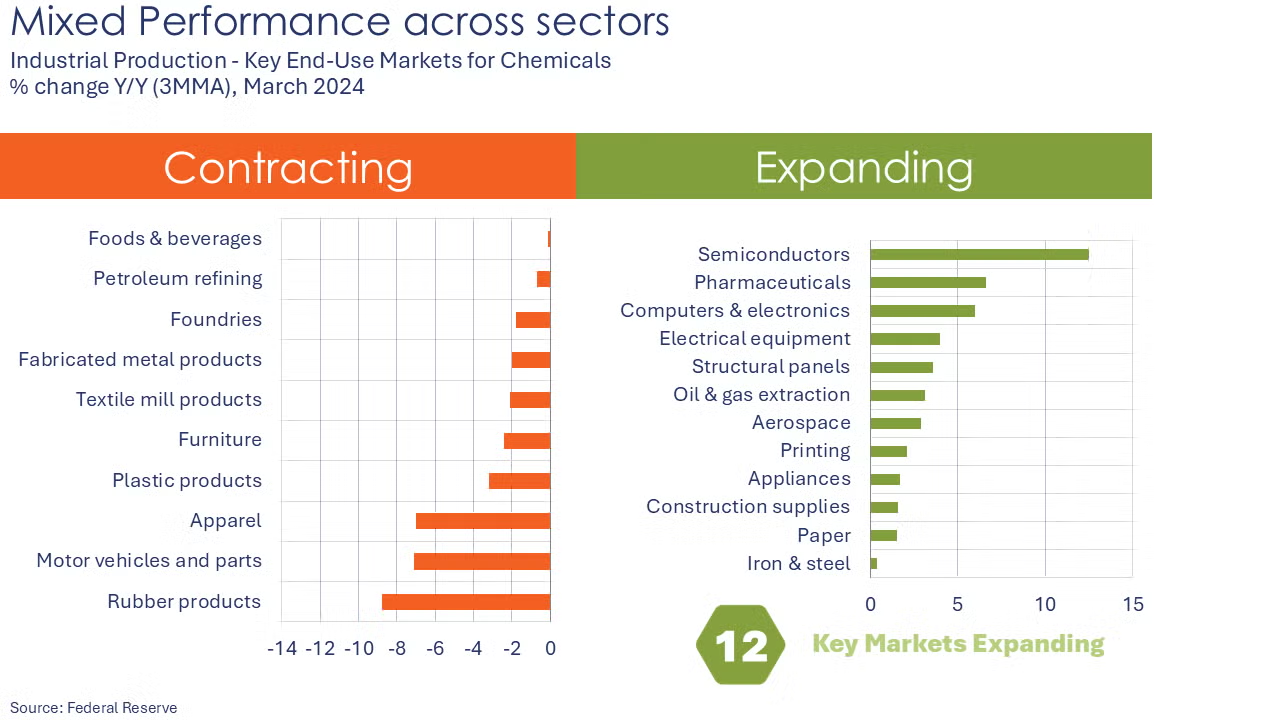
Following three consecutive gains, industrial production fell 0.3% in March. The decline was led by sharply lower utility output, reflecting warmer weather across much of the country. Mining and manufacturing output were higher in March, ahead of the announcement of tariffs on April 2nd. Within manufacturing, results were mixed. The largest gains were in aerospace, apparel, motor vehicles and electronics. Those gains were partially offset by large declines in the production of wood products, petroleum products and textiles. Compared to a year ago, overall industrial production was up 1.3% Y/Y. Capacity utilization moved 0.4 points lower to 77.8%, which was the same rate as a year ago. Over the same time, overall industrial capacity was 1.3% higher.
Two regional Fed surveys suggest deteriorating manufacturing conditions in April. Manufacturing activity continued to contract for a second month in the Empire State (New York) with the headline activity index up 11.9 points to -8.1 (a reading below zero indicates contraction). In addition, firms expect conditions to worsen substantially over the months ahead. The Philadelphia Fed’s Manufacturing Outlook Survey fell 39 points to -26.4, a two year low. The decline was led by a sharp deterioration in new orders. Expectations for six months ahead were lower, but remained positive.
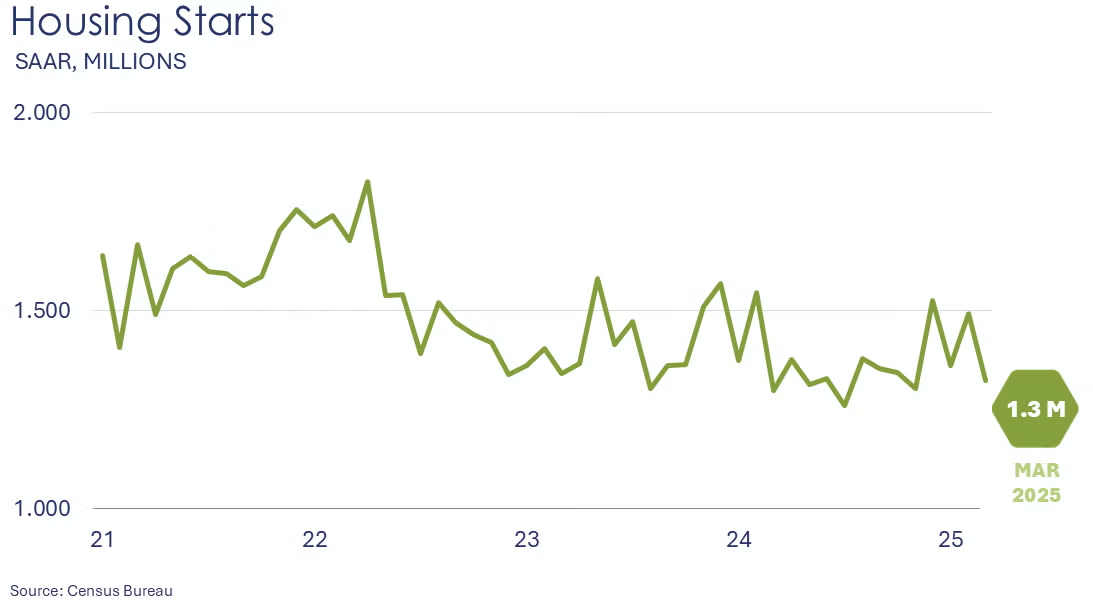
Housing starts fell 11.4% in March, led by a 14.2% decline in chemistry-intensive single-family homes. Building activity was lower in the larger South and West regions, but there were gains in the Northeast and Midwest. Forward-looking building permits rose, however, up by 1.6%. Permits for single-family construction declined, but were offset by permits for multifamily projects. Compared to a year ago, housing starts were up 1.9% while building permits were off slightly (0.2%).
NAHB/Wells Fargo homebuilder sentiment edged slightly higher from 39 in March to 40 in April. While current sales conditions and buyer traffic improved, sales expectations fell sharply.
Retail and food service sales accelerated in March, up by 1.4% as consumers rushed to beat tariffs. Sales were higher across nearly every major category, except gasoline stations (where lower fuel prices likely had an impact) and furniture & home furnishing stores (reflecting a lackluster housing market). Sales at auto dealers surged 5.3%. Sales at building supply & garden centers, sporting goods stores, and restaurants also rose solidly. Compared to a year ago, retail sales were up 4.6% Y/Y.
Combined business inventories (manufacturing, wholesale, and retail) continued to move higher in February, up by 0.2%. Wholesale inventories rose 0.3%, while manufacturing and retail inventories were up 0.1%. Combined business sales jumped 1.2% with gains across all three segments. The inventories-to-sales ratio edged lower from 1.36 in January to 1.35 in February. Compared to a year ago, inventories were up 2.1% Y/Y while sales were ahead by 3.6% Y/Y.
Import prices eased by 0.1% in March, ahead of tariff impacts. The decline was led by lower prices for imported fuels. Prices for nonfuel imports ticked slightly higher, up 0.1%. Compared to a year ago, headline import prices were up 0.9% Y/Y with prices for nonfuel imports up 1.5% Y/Y. Export prices were flat during the month, following gains the previous three months. Compared to a year ago, export prices were 2.4% higher.
ACC Survey of Economic Forecasters
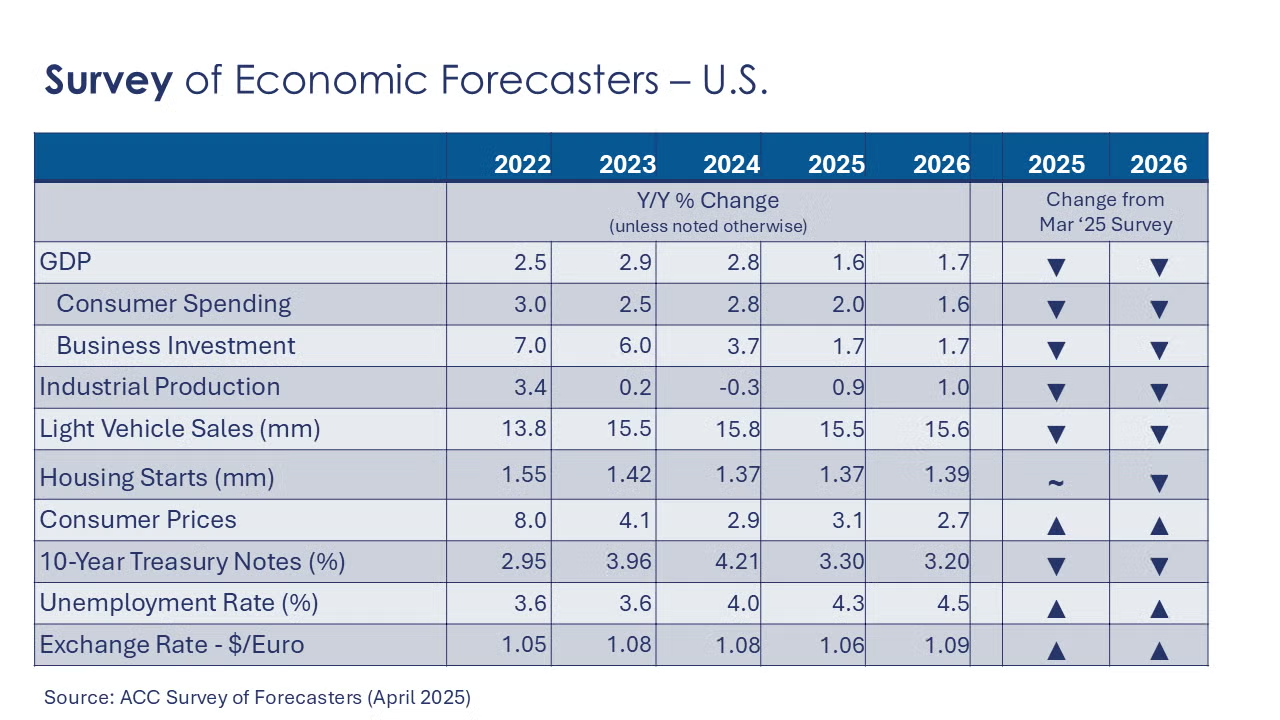
The beginning of Q2 began with the announcement of a massive increase in tariffs on U.S. imports, followed by announced retaliation by China and Canada (on non-USMCA compliant autos). Uncertainty has increased substantially, raising the risk of a downturn in the U.S. economy. While a recession is not in the forecast, there’s no denying the odds have risen. As a result, the majority of indicators in our Survey of Forecasters have deteriorated since March.
- Growth in U.S. GDP is expected to slow to 1.6% in 2025 before expanding by 1.7% in 2026.
- Growth in consumer spending is expected to moderate to a 2.0% pace in 2025 before easing further to a 1.6% gain in 2026.
- Business investment growth is expected to slow to 1.7% in 2025 and grow by another 1.7% in 2026.
- Following a 0.3% decline in 2024, we look for industrial production to grow only 0.9% in 2025 and 1.0% in 2026. Certain industries will be more impacted by tariffs than others.
- In 2025, vehicle sales are expected to ease to a 15.5 million pace (from 15.8 million in 2024) before recovering only slightly to 15.6 million in 2026.
- Housing starts fell to 1.37 million in 2024 and are expected to be essentially flat in 2025. A slight improvement is expected in 2026 with housing starts rising to 1.39 million.
- The unemployment rate is expected to move higher as the labor market continues to rebalance and a downturn reduces labor demand. The unemployment rate is expected to average 4.3% in 2025 and 4.5% in 2026.
- Prior to the tariff announcements, there had been further progress on inflation. Growth in consumer prices is now expected to accelerate in 2025 to a 3.1% pace before easing to a 2.7% pace in 2026.
- With clouds on the horizon, expectations for the 10-year Treasury are lower for 2025 and 2026.
The Survey of Economic Forecasters data are available to ACC members on ACC Exchange.
ENERGY
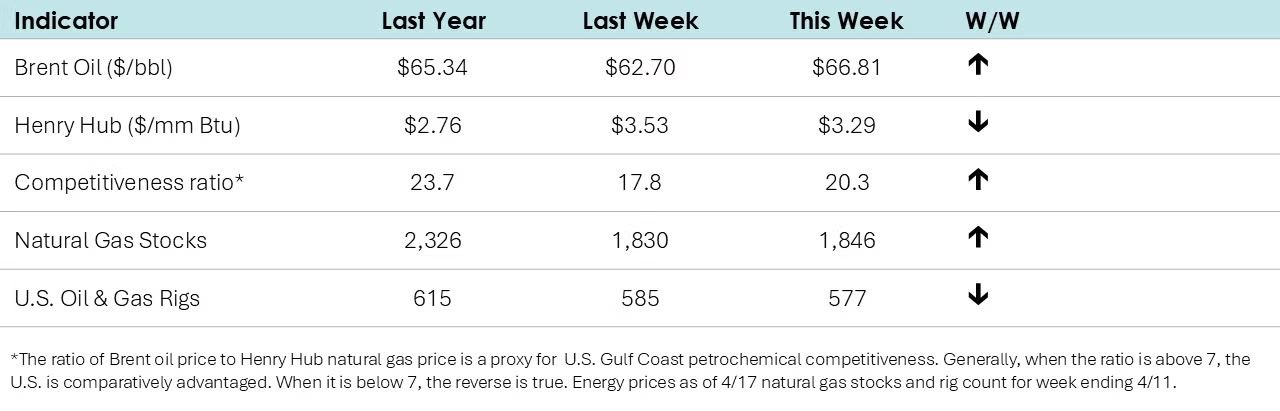
- Oil prices moved higher compared to last week as new sanctions were put in place targeting Chinese imports of Iranian oil and Iraq agreed to cut its oil exports.
- U.S. natural gas prices eased on warmer temperatures.
- The combined oil and gas rig count fell by eight to 577.
CHEMICALS
Indicators for the business of chemistry suggest a yellow banner.

According to data released by the Association of American Railroads, chemical railcar loadings were down to 32,222 for the week ending 12 April. Loadings were up 2.3% Y/Y (13-week MA), up (2.0%) YTD/YTD and have been on the rise for eight of the last 13 weeks.
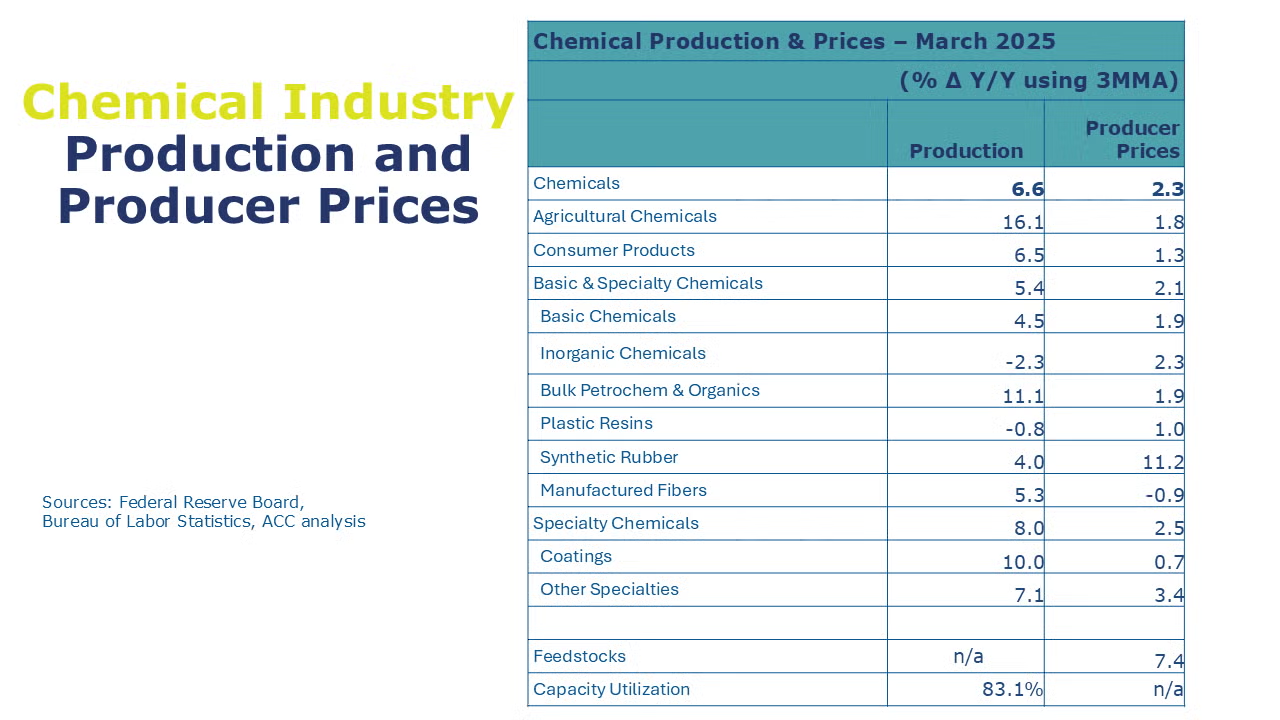
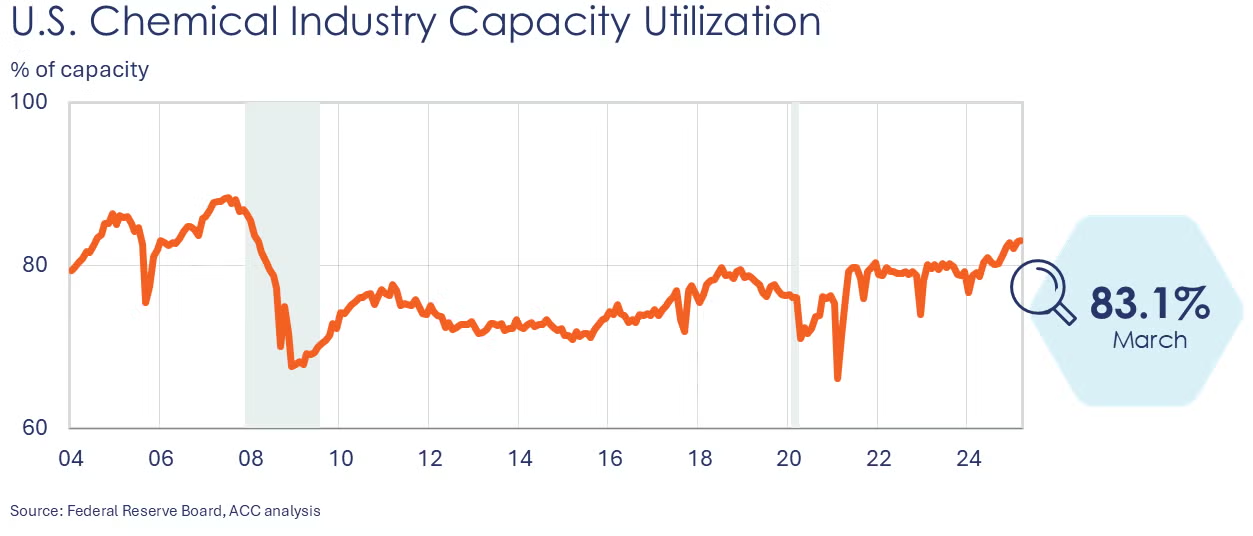
The Federal Reserve’s industrial production index for chemicals moved slightly higher in March, up by 0.2% to 100.3. This was the highest level since July 2018. Output was higher for agricultural chemicals, synthetic rubber, manufactured fibers, coatings, and other specialty chemicals. These gains were offset by lower production of inorganic chemicals, plastic resins, and consumer products. Compared to a year ago, chemical production up 5.8% Y/Y. Output of organic chemicals was flat. Capacity utilization tightened to 83.1%. Note: ACC is using new data from the Federal Reserve to calculate capacity utilization, so data from previous months is not comparable.
Chemical import prices fell for a third consecutive month in March, edging lower by 0.1%. Export prices were slightly higher, up by 0.1%, the fourth consecutive gain. Compared to a year ago, chemical import prices were off 1.3% Y/Y while export prices were 3.0% higher.
Note On the Color Codes
Banner colors reflect an assessment of the current conditions in the overall economy and the business chemistry of chemistry. For the overall economy we keep a running tab of 20 indicators. The banner color for the macroeconomic section is determined as follows:
Green – 13 or more positives
Yellow – between 8 and 12 positives
Red – 7 or fewer positives
There are fewer indicators available for the chemical industry. Our assessment on banner color largely relies upon how chemical industry production has changed over the most recent three months.
For More Information
ACC members can access additional data, economic analyses, presentations, outlooks, and weekly economic updates through ACCexchange.
In addition to this weekly report, ACC offers numerous other economic data that cover worldwide production, trade, shipments, inventories, price indices, energy, employment, investment, R&D, EH&S, financial performance measures, macroeconomic data, plus much more. To order, visit the ACC Store.
Every effort has been made in the preparation of this weekly report to provide the best available information and analysis. However, neither the American Chemistry Council, nor any of its employees, agents or other assigns makes any warranty, expressed or implied, or assumes any liability or responsibility for any use, or the results of such use, of any information or data disclosed in this material.
Questions? Contact us via email.

