MACROECONOMY & END-USE MARKETS
Running tab of macro indicators: 11 out of 20
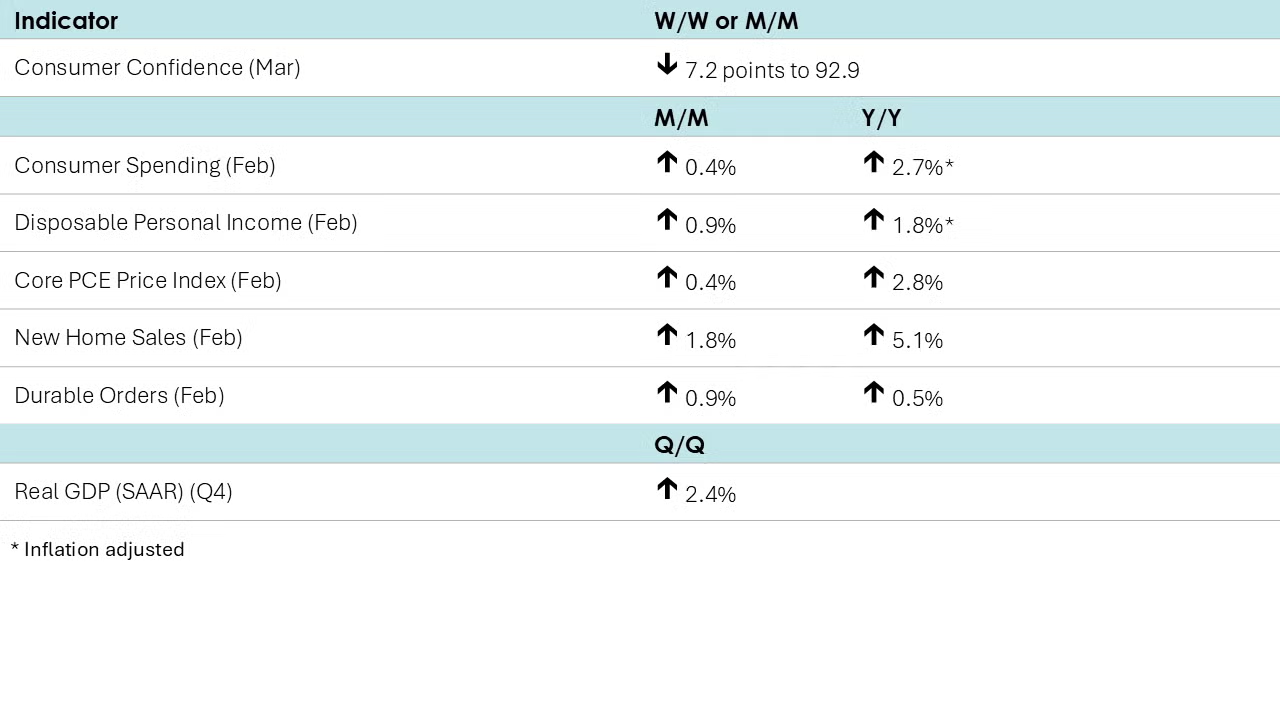
Consumer spending rebounded in February, up 0.4% (compared to a 0.3% decline in January). Gains in spending on goods outpaced growth in services spending. Disposable personal income (DPI) also rose, up 0.9%. After adjusting for inflation, real consumer spending was up 2.7% Y/Y while real DPI was up 1.8% Y/Y. The headline price index for personal consumption expenditures (PCE) was up 2.5% Y/Y, the same as last month. Excluding food and energy, the core PCE price index was up 2.8% Y/Y, slightly higher than in January. It is the core PCE price index that is the Fed’s preferred inflation measure.
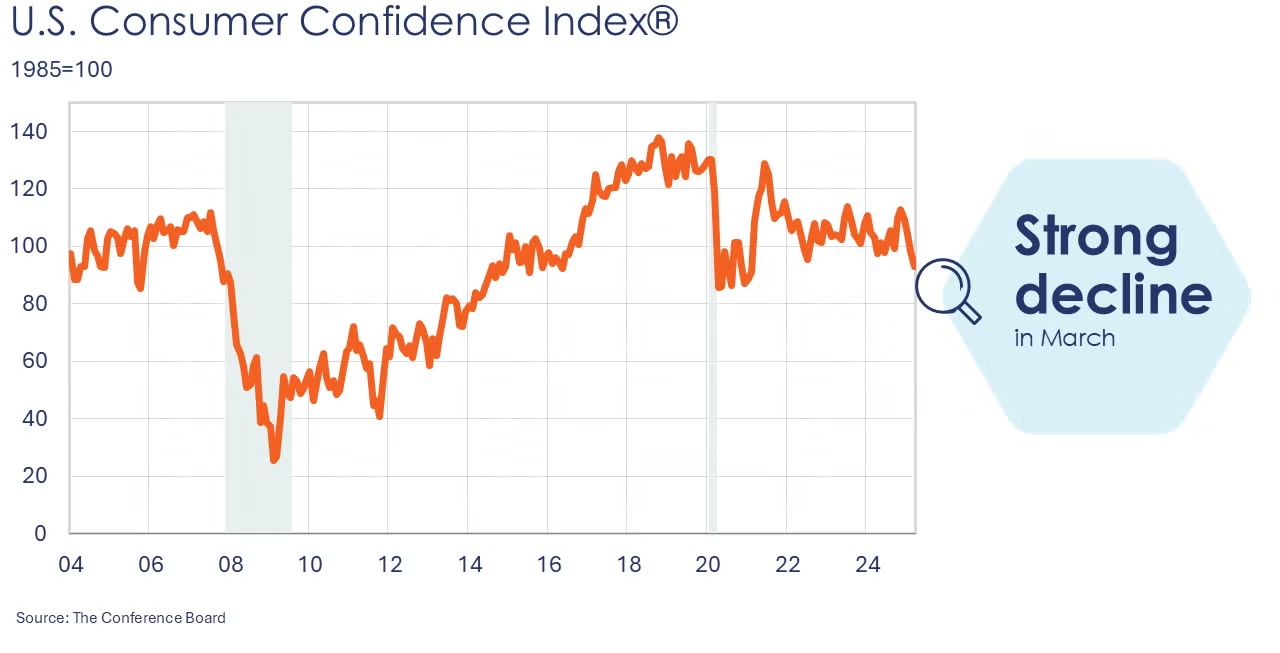
Consumer confidence continued to slide for a fourth consecutive month in March, down 7.2 points to 92.9. Consumers’ expectations for the future fell to a 12-year low. Consumers’ purchasing plans for both homes and cars declined. Consumers’ intentions to purchase big-ticket items, including electronics and appliances, ticked higher, which may reflect plans to buy before impending tariffs lead to price increases.
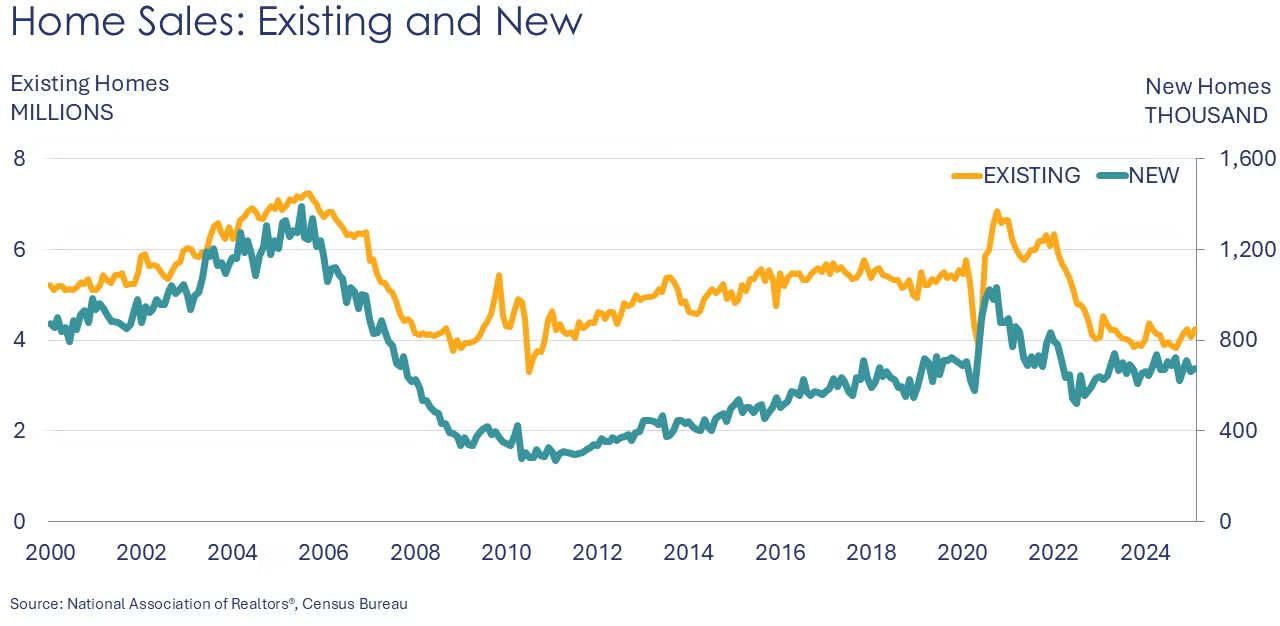
New home sales rose 1.8% in February after a decline in January. Compared to a year ago, sales were up 5.1% Y/Y. Inventories of unsold homes surged to an 18-year high and now represent an 8.9-month supply at the current sales pace. The median price eased 1.5% to $414,500.
Durable goods orders expanded in February, up by 0.9% (and up 0.5% Y/Y). February’s gain was led by a 4.0% increase in orders for motor vehicles and parts. There were also gains in orders of electrical equipment, metals & metal products, computers, machinery, and defense aircraft. Orders for civilian aircraft and communications were lower. Orders for core durable goods (nondefense capital goods excluding aircraft) eased by 0.3% and were off 1.2% Y/Y.
The third and final estimate of Q4 GDP shows that the U.S. economy expanded at a 2.4% seasonally adjusted annual rate (SAAR) at the end of last year, slightly higher than the previous two estimates. The largest contribution was from consumer spending, with smaller gains from residential investment, net trade, and government expenditures. Compared to Q4 2023, U.S. GDP was 2.5% higher.
ENERGY
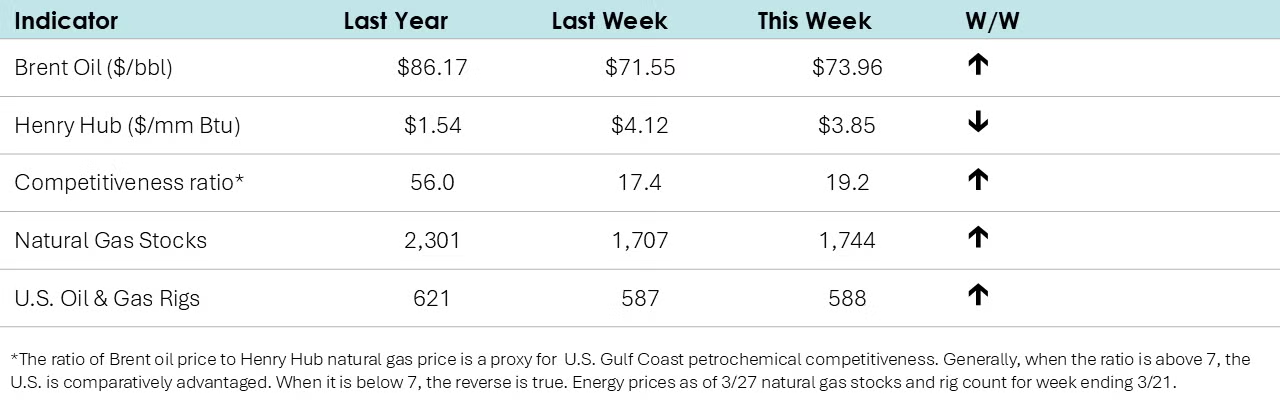
• Oil prices were higher than a week ago, as concerns about Venezuelan supply offset the impact from a limited Russia-Ukraine truce.
• Natural gas prices moved lower as natural gas inventories posted a second consecutive build last week.
• The combined oil & gas rig count rose by one to 588.
CHEMICALS
Indicators for the business of chemistry suggest a yellow banner.
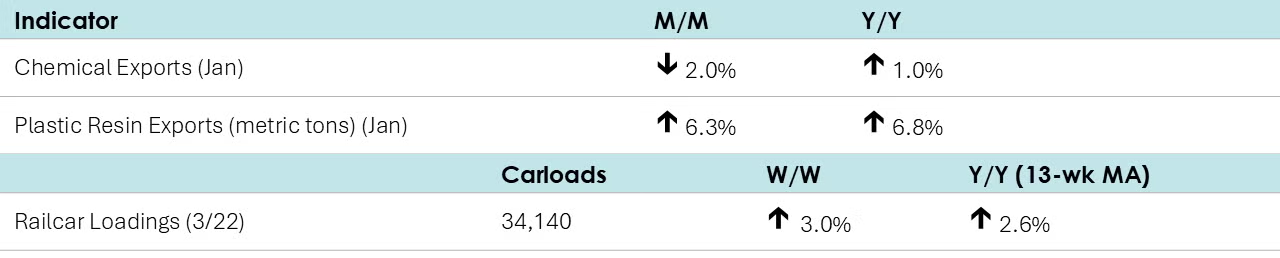
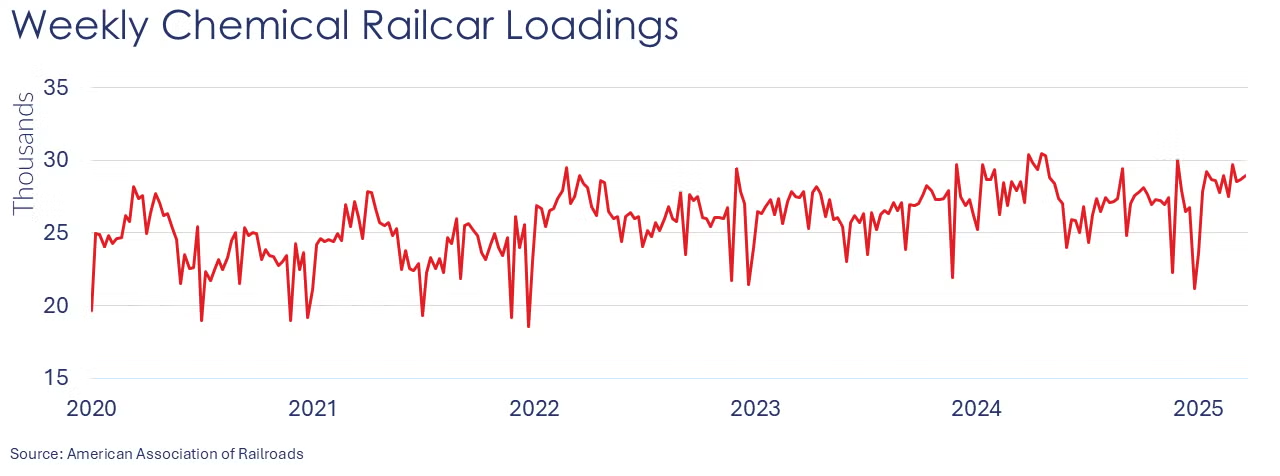
According to data released by the Association of American Railroads, chemical railcar loadings were up to 34,140 for the week ending March 22nd. Loadings were up 2.6% Y/Y (13-week MA), up (1.9%) YTD/YTD and have been on the rise for eight of the last 13 weeks.
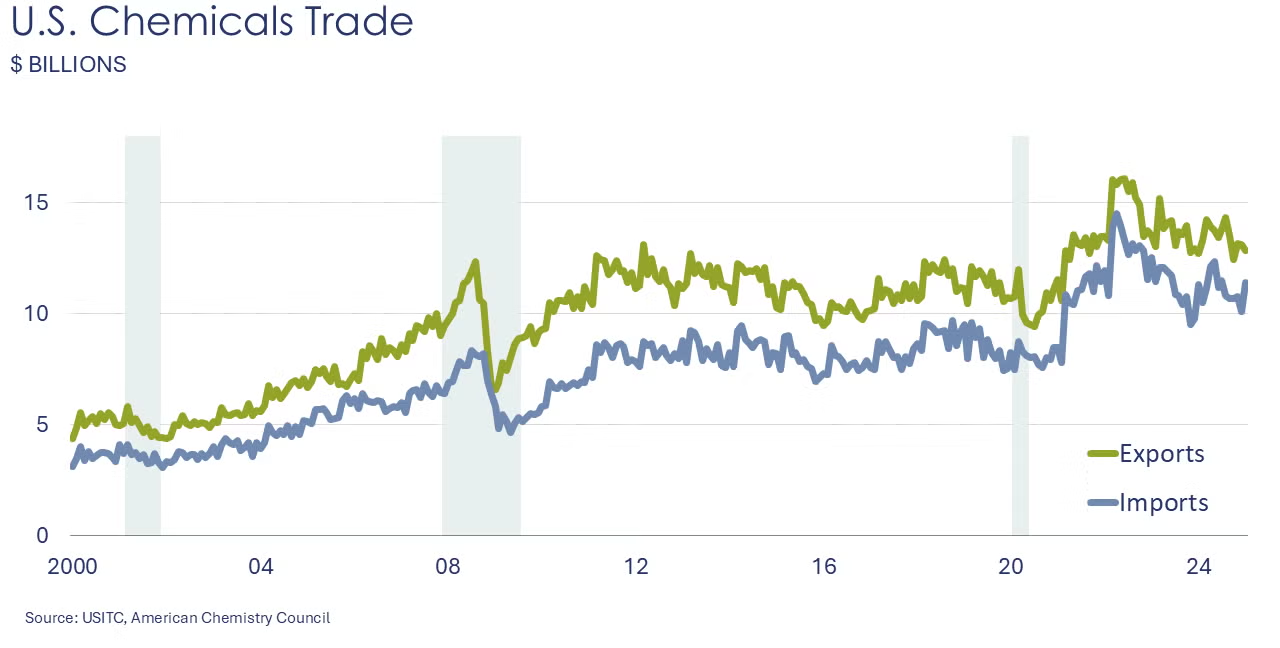
Chemical exports fell 2.0% in January to $12.8 billion. Exports were lower for inorganic chemicals, bulk petrochemicals & intermediates, manufactured fibers, other specialty chemicals, agricultural chemicals and consumer products. These declines were partially offset by higher exports of plastic resins, synthetic rubber, other basic chemicals, coatings and adhesives. Chemical imports surged 13.3% to $11.4 billion during the month, with gains across most categories. The monthly trade balance in chemicals fell sharply to $1.4 billion. Compared to a year ago, chemical exports were up 1.0% while imports were 0.9% higher.
Note On the Color Codes
Banner colors reflect an assessment of the current conditions in the overall economy and the business chemistry of chemistry. For the overall economy we keep a running tab of 20 indicators. The banner color for the macroeconomic section is determined as follows:
Green – 13 or more positives
Yellow – between 8 and 12 positives
Red – 7 or fewer positives
There are fewer indicators available for the chemical industry. Our assessment on banner color largely relies upon how chemical industry production has changed over the most recent three months.
For More Information
ACC members can access additional data, economic analyses, presentations, outlooks, and weekly economic updates through ACCexchange.
In addition to this weekly report, ACC offers numerous other economic data that cover worldwide production, trade, shipments, inventories, price indices, energy, employment, investment, R&D, EH&S, financial performance measures, macroeconomic data, plus much more. To order, visit the ACC Store.
Every effort has been made in the preparation of this weekly report to provide the best available information and analysis. However, neither the American Chemistry Council, nor any of its employees, agents or other assigns makes any warranty, expressed or implied, or assumes any liability or responsibility for any use, or the results of such use, of any information or data disclosed in this material.
Contact us at ACC_EconomicsDepartment@americanchemistry.com.

