MACROECONOMY & END-USE MARKETS
Running tab of macro indicators: 11 out of 20

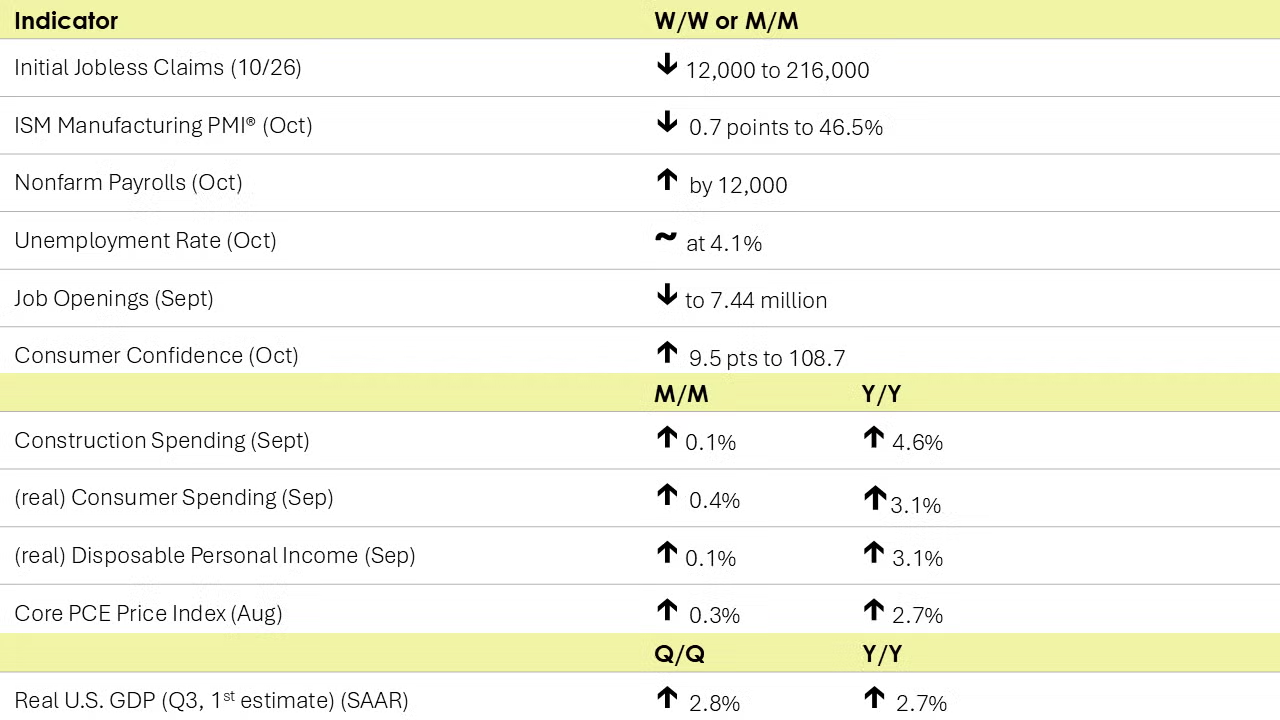
The number of new jobless claims fell by 12,000 to 216,000 during the week ending October 26. Continuing claims fell by 26,000 to 1.862 million, and the insured unemployment rate for the week ending October 19 was unchanged at 1.2%.
Nonfarm payrolls rose by only 12,000 in October, the lowest monthly build since the pandemic lockdowns and well below expectations. In September, nonfarm payrolls rose by 223,000. Because of Hurricanes Helene and Milton and the Boeing strike, however, it is difficult to interpret the underlying employment trend. Manufacturing employment fell by 46,000 with a sharp decline in transportation equipment. Employment in nondurable manufacturing rose by 1,000 (led by higher employment in food and paper manufacturing). Average hourly earnings for all employees rose 4.0% Y/Y to $35.46. Wage growth has accelerated from 3.9% Y/Y in September and August and 3.6% Y/Y in July. Labor is a major cost component for services which are still experiencing price pressures. The Fed meets next week to determine the next move and a 25-basis point cut is expected.
The unemployment rate remained stable at 4.1% for a second month. The civilian labor force fell by 220,000 and the number of employed people fell, according to the household survey. The labor force participation rate eased to 62.6% in October from 62.7% in September.
As the labor market continues to cool, job openings eased in September to 7.4 million, the lowest level since early-2021. The ratio of job openings to the number of unemployed people was 1.1:1, compared to nearly 2:1 at the end of 2022. The number of hires rose while the number of voluntary quits fell.

The U.S. economy continued to grow at a solid clip during the third quarter. Real (inflation-adjusted) U.S. GDP rose by a seasonally adjusted annual rate of 2.8% in Q3. GDP rose at a 3.0% pace in Q2. The largest contributors to growth in Q3 were consumer spending (both goods and services), exports, federal government spending, and business investment. These gains were offset by higher inventories, lower residential investment, and lower inventory investment. Compared to a year ago, GDP was up by 2.7%. Growth in the price index for GDP rose 2.2% Y/Y (compared to 2.6% Y/Y in Q2) and excluding food and energy, growth in the core price index decelerated from 2.8% Y/Y to 2.6% Y/Y.
Consumer spending (aka personal consumption expenditures or PCE) accelerated in September, up by 0.5%. After accounting for inflation, real consumer spending was up 0.4%. Consumers increased their outlays on services, in addition to both durable and nondurable goods. Aggregate disposable personal income rose 0.3% (up 0.1% after adjusting for inflation) driven by gains in employee compensation. Growth in the PCE price index eased to 2.1% Y/Y (down from 2.3% Y/Y in August) while growth in the Fed-preferred inflation measure, the core PCE price index, remained steady at 2.7% Y/Y for a third month.

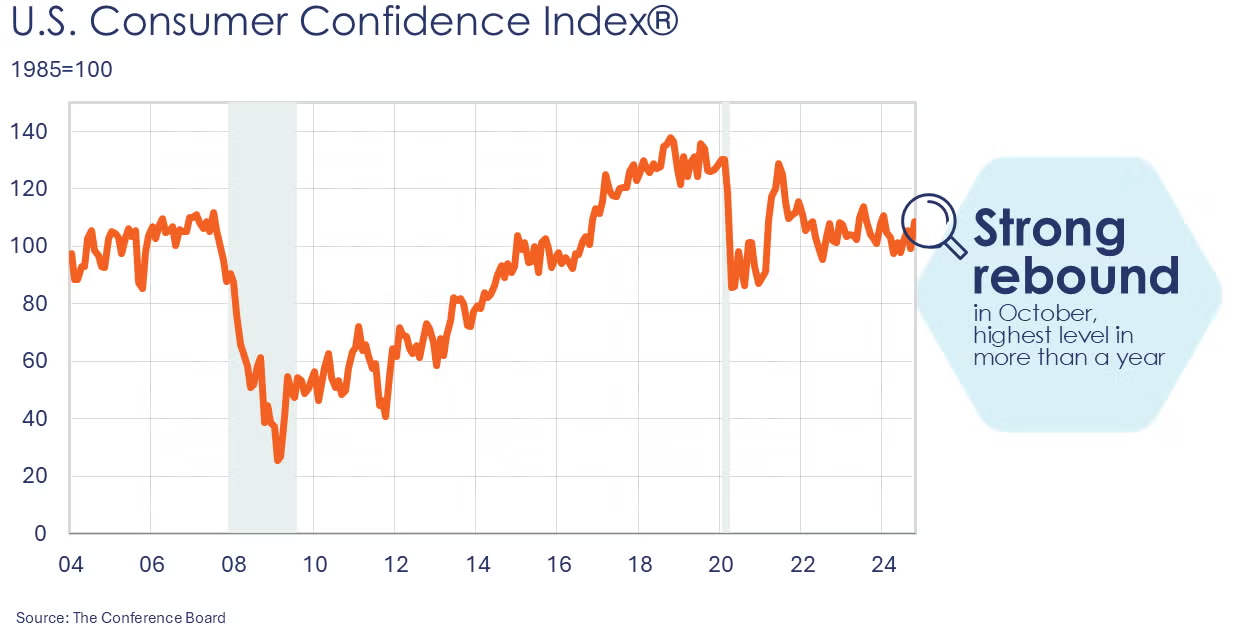
The Conference Board’s Consumer Confidence Index® jumped by 9.5 points to 108.7 in October, it’s strongest monthly gain since March 2021. All five subcomponents of the index improved. Despite the recent deceleration in overall inflation and falling gas prices, average 12-month inflation expectations rose to 5.3% in October from 5.2% last month. Purchasing plans for homes and new cars continued to increase. Consumer buying plans were mixed for big-ticket appliances and down slightly for electronics.
The ISM Manufacturing PMI fell 0.7 points to 46.5% in October, its lowest reading in 2024. The index has remained below 50 (indicating contraction) for 23 of the past 24 months. Only five industries were reported to have expanded while 11 contracted (including chemical products). Manufacturing production and order backlogs moved further into contraction while new orders, export orders, and employment contracted at a slower pace compared to September. Supplier deliveries were slower. Inventories contracted at a faster pace while customers’ inventories were deemed to be “too low” after being judged “about right” in September. The manufacturing sector continues to struggle with weak demand for goods and likely some value chain impacts from the Boeing strike.
Texas manufacturing activity rose in October by 18 points to 14.6, the highest reading in two years. The new orders index was negative, indicating a decline in demand, while the indices for shipments and capacity utilization both posted large gains. Manufacturers’ perception of business conditions remained negative. Looking ahead, manufacturers expect activity to increase.
Construction spending rose by 0.1% in September to a level up 4.6% Y/Y. Spending on publicly funded projects rose by 0.5% while private construction spending was flat, reflecting a 0.2% gain in residential that was offset by a 0.1% decline in nonresidential. Spending rose in new single-family projects but declined in multifamily. Multifamily was down 8.1% Y/Y. Spending on manufacturing projects declined by 0.2% in September but was 20.5% higher compared to the same time last year.
ENERGY

Oil prices were a little lower than a week ago on better-than-expected inventory numbers. U.S. natural gas prices were higher this week despite ongoing warm weather for late-October and ample inventories. The combined oil and gas rig count remained steady at 581.
CHEMICALS
Indicators for the business of chemistry suggest a yellow banner.

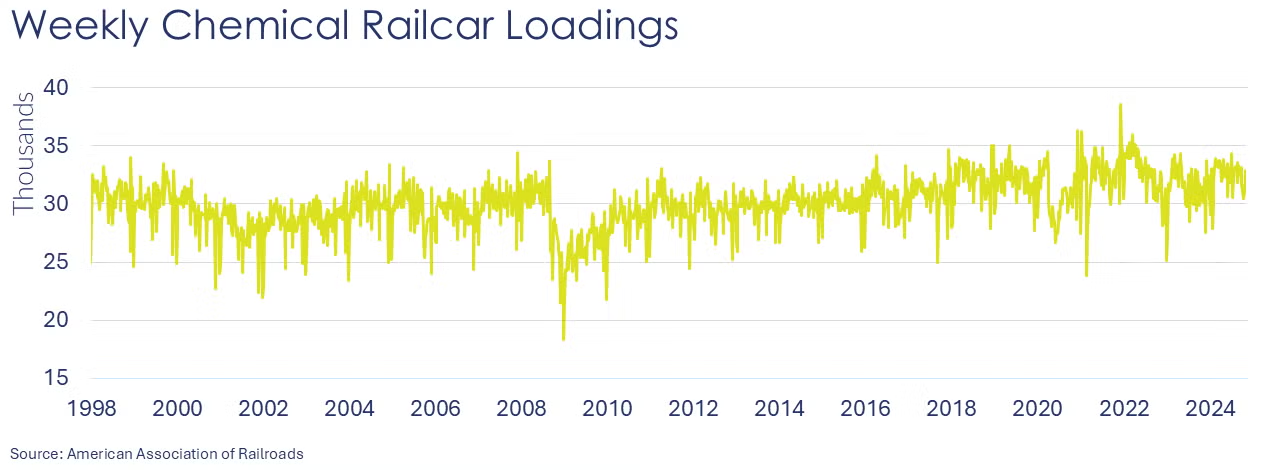
According to data released by the Association of American Railroads, chemical railcar loadings were up to 32,838 for the week ending October 26. Loadings were up 4.2% Y/Y (13-week MA), up (4.0%) YTD/YTD and have been on the rise for 6 of the last 13 weeks.

U.S. production of major plastic resins totaled 8.2 billion pounds during September 2024, a decrease of 8.1% compared to the prior month, and an increase of 4.5% compared to the same month in 2023, according to ACC statistics. Year-to-date production was 76.0 billion pounds, a 5.6% increase as compared to the same period in 2023. Sales and captive (internal) use of major plastic resins totaled 8.1 billion pounds during September 2024, a decrease of 0.5% compared to the prior month, and 0.0% change from the same month one year earlier. Year-to-date sales and captive use were 75.6 billion pounds, a 6.1% increase as compared to the same period in 2023.

Within the details of the ISM manufacturing PMI report, the chemical industry was one of the industries reported to be in contraction in October. The chemical industry reported lower activity across several metrics, including production, new orders, new export orders, employment, order backlogs, inventories and imports. The industry assessed its customers’ inventories as “too low”. One chemical industry respondent noted, “Right-sizing continues. Contingency plans have been formulated to anticipate trade policies that will impose tariffs on key materials.”
Amongst comments from the Texas manufacturing activity survey were two comments from chemical manufacturers: “Interest rate impacts continue to put pressure on the overall construction markets and auto industry, which are major customers of the basic materials space.” And “Chinese producers are selling chemicals products at prices that are, in some cases, lower than our production costs in the U.S.”
Chemical industry employment fell slightly in September, down 0.1% to 558,500, a level up 0.4% Y/Y. Employment in plastic resin manufacturing was also lower, down by 0.5% to 61,200. Resin manufacturing was 1.4% lower than a year ago, however. (Note that data at the detailed industry level are lagged one month behind the headline jobs report.)
In October, chemical and pharmaceutical industry employment fell slightly lower to 902,100. Average hourly earnings rose by 3.8% Y/Y, a faster pace than in the previous four months. Average weekly hours rose by 12 minutes to 41.0 hours. Production jobs rose while supervisory and non-production workers declined. With gains in the number of production workers and weekly hours, the total labor input into chemical and pharmaceutical manufacturing edged slightly higher, in contrast to the ISM Manufacturing PMI report.
Chemical construction spending rose by 0.4% to $37.3 billion in September, a level 9.8% higher than a year ago. Chemical construction spending represents about 16% of total manufacturing construction spending.
Note On the Color Codes
Banner colors reflect an assessment of the current conditions in the overall economy and the business chemistry of chemistry. For the overall economy we keep a running tab of 20 indicators. The banner color for the macroeconomic section is determined as follows:
Green – 13 or more positives
Yellow – between 8 and 12 positives
Red – 7 or fewer positives
There are fewer indicators available for the chemical industry. Our assessment on banner color largely relies upon how chemical industry production has changed over the most recent three months.
For More Information
ACC members can access additional data, economic analyses, presentations, outlooks, and weekly economic updates through ACCexchange: https://accexchange.sharepoint.com/Economics/SitePages/Home.aspx
In addition to this weekly report, ACC offers numerous other economic data that cover worldwide production, trade, shipments, inventories, price indices, energy, employment, investment, R&D, EH&S, financial performance measures, macroeconomic data, plus much more. To order, visit http://store.americanchemistry.com/.
Every effort has been made in the preparation of this weekly report to provide the best available information and analysis. However, neither the American Chemistry Council, nor any of its employees, agents or other assigns makes any warranty, expressed or implied, or assumes any liability or responsibility for any use, or the results of such use, of any information or data disclosed in this material.
Contact us at ACC_EconomicsDepartment@americanchemistry.com.

