MACROECONOMY & END-USE MARKETS
Running tab of macro indicators: 11 out of 20
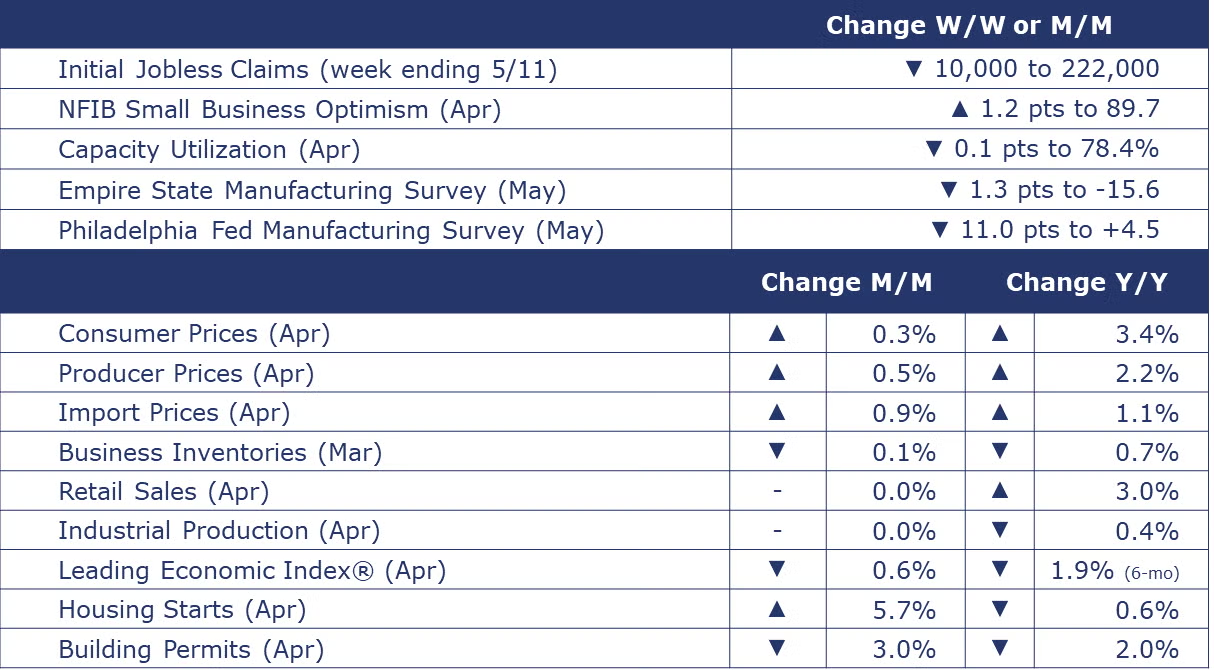
The number of new jobless claims fell by 10,000 to 222,000 during the week ending May 11. Continuing claims increased by 13,000 to 1.794 million, and the insured unemployment rate for the week ending May 4 was unchanged at 1.2%.
Following gains in February and March, retail sales were flat in April. Within segments, sales were mixed. There were gains in sales at gas stations (reflecting higher gasoline prices), clothing stores, food & beverage stores, and restaurants. Sales at nonstore retailers (dominated by online platforms) fell. Amazon’s Big Spring Sale was at the end of March and may have pulled sales forward. Also, Easter was at the end of March and many Spring Breaks were the week before, potentially boosting March sales. Compared to a year ago, retail sales were up 3.0% Y/Y.
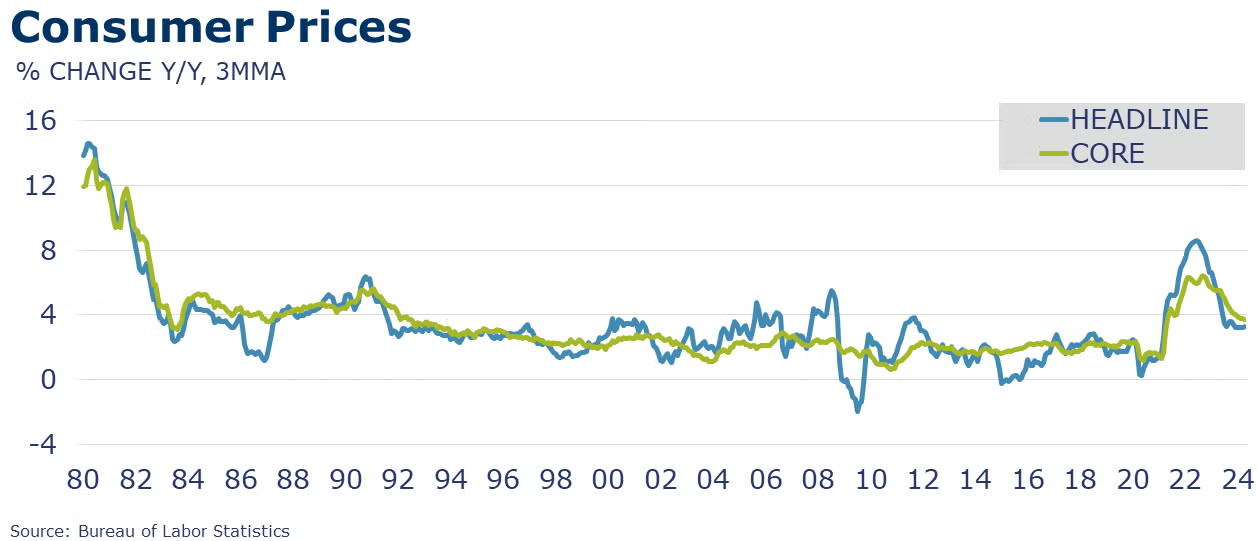
Consumer prices rose 0.3% in April, in line with expectations. Excluding food and energy, core prices also rose by 0.3%. Core prices for commodities eased while growth in prices for services decelerated. Compared to a year ago, headline consumer prices were up 3.4% Y/Y while core consumer prices were 3.6% higher. It was the smallest annual gain in core consumer prices in three years and welcome news for those looking for signs that inflation is moving closer to the Fed’s target.
Headline producer prices rose more than expected in April, up by 0.5% compared to March. Nearly three-quarters of the April advance is from the acceleration in final demand services. On the goods side, much of the gain was in energy prices, notably gasoline, electric power, and residential natural gas. Excluding food and energy, core producer prices were also up 0.4%. Compared to a year ago, headline producer prices were up 2.2% Y/Y and core producer prices were up 3.1% Y/Y, the highest annual comparisons in a year for both measures.
Combined business inventories eased by 0.1% in March with gains in manufacturing and retail inventories offset by declining inventories at the wholesale level. The combined sales of manufacturers, retailers, and wholesalers also ticked lower by 0.1%, again with gains in manufacturing and retail sales offsetting a decline in sales at the wholesale level. Compared to a year ago, business inventories were up 0.7% Y/Y, and sales were up 2.1% Y/Y. The inventories-to-sales ratio was unchanged compared to March at 1.37. A year ago, the ratio was slightly higher at 1.39.
Led by gains in fuel imports, U.S. import prices rose by 0.9% in April, following a 0.6% gain in March. Over the past 12 months, import prices rose 1.1%. Fuel import prices are up 3.3% over the past 12 months. Export prices rose 0.5% in April, following a 0.1% advance in March. Over the past 12 months, export prices declined by 1.0%.
Housing starts gained in April, offsetting the losses in March. Starts increased to a 1.36-million-unit pace, which was up 5.7% M/M but down 0.6% Y/Y. Gains in the multifamily segment offset losses in single-family construction. Starts were up in the Midwest and South but down in the Northeast and West. Building permits were at a 1.44-million-unit pace, which was down 3.0% M/M and 2.0% Y/Y. Permits for single-family homes fell 0.8% M/M but were up 11.4% Y/Y. Permits declined in the Midwest and West but increased in the Northeast and South.
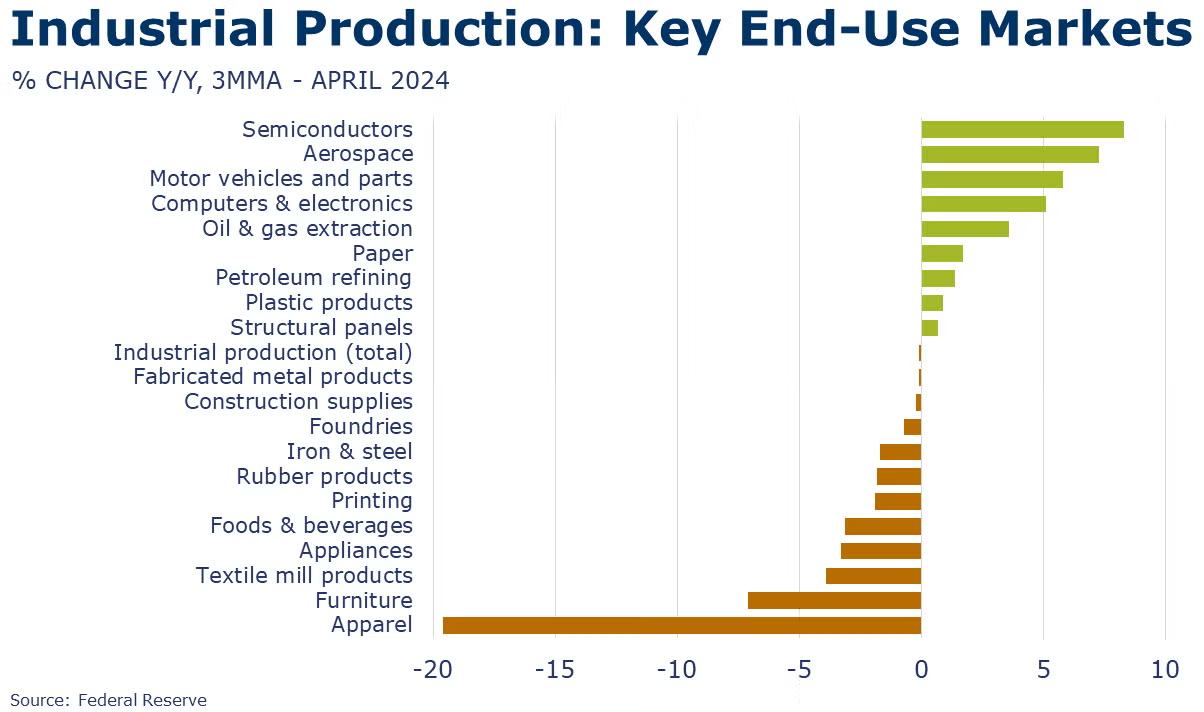
Following gains in the previous two months, industrial production stalled in April with declines in manufacturing and mining output that were offset by higher utility output. The largest declines were in petroleum products, motor vehicles, electrical equipment, and wood products. These were partially offset by gains in primary metals, aerospace, and food & beverages. Industrial production was off 0.4% Y/Y. Capacity utilization eased slightly from 78.5% in March to 78.4% in April. Last April, capacity utilization stood at 79.8%. Industrial capacity was higher by 1.4% Y/Y.
The Conference Board’s Leading Economic Index® continued to slide in April, down by 0.6%. Over the past six months, the LEI contracted by 1.9%. The LEI is signaling softer conditions ahead. According to the Conference Board, “Deterioration in consumers’ outlook on business conditions, weaker new orders, a negative yield spread, and a drop in new building permits fueled April’s decline.”
SURVEY OF ECONOMIC FORECASTERS
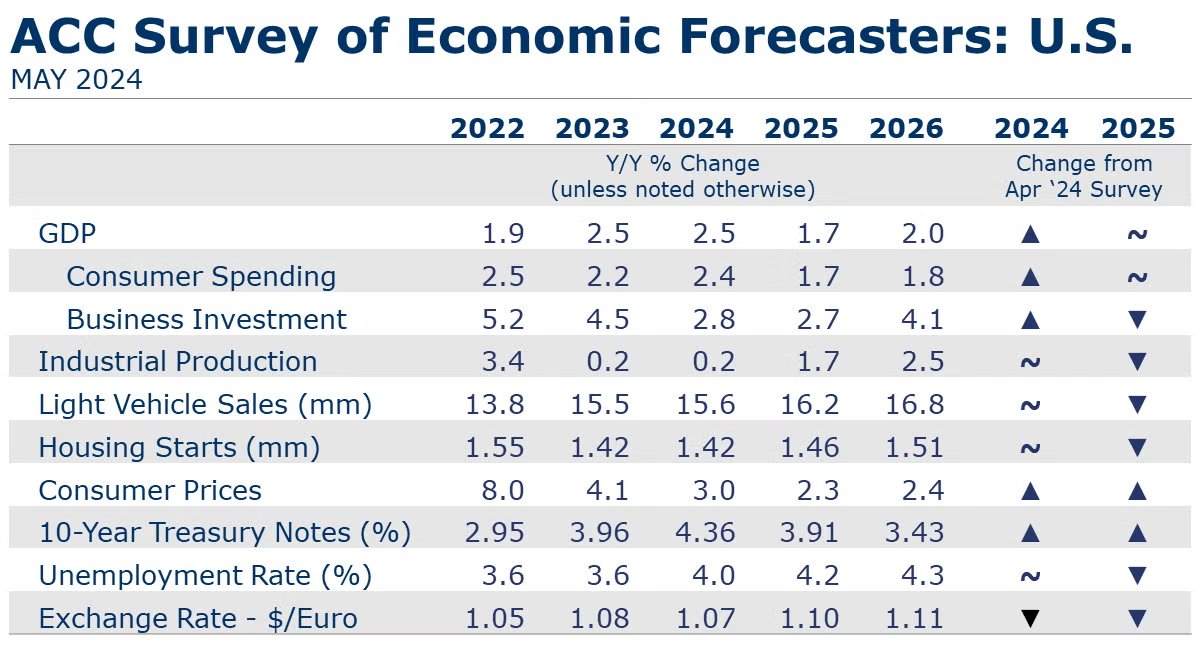
- The U.S. economy remains on solid ground. Despite some cooling, the labor market remains relatively tight and rising incomes are supporting spending. Expectations for 2024 continued to improve for several key indicators.
- U.S. GDP is expected to grow by 2.5% in 2024 and by 1.7% in 2025.
- Consumer spending is expected to grow at last year’s 2.4% Y/Y pace in 2024 but will slow to a 1.7% gain in 2025.
- Higher borrowing costs and election uncertainty have dampened business investment which is expected to decelerate to a 2.7% pace in 2025 and then a 4.1% gain in 2026 as interest rates decline.
- Following a 0.2% gain in 2023, we look for industrial production to come in around the same pace (0.2%) in 2024 before strengthening to a 1.7% pace in 2025.
- Sales of autos and light trucks are expected to grow to 15.6 million in 2024 (still below trend) before rising to a 16.2 million pace in 2025.
- With mortgage rates recently above 7% again, housing starts are expected to remain essentially flat at 1.42 million in 2024 before rising to a 1.46 million pace in 2025 as rates come down.
- The unemployment rate is expected to move higher as the labor market rebalances averaging 4.0% in 2024 and 4.2% in 2025.
- Recent data shows that inflation remains above the Fed’s target, though there has been some improvement after an acceleration in Q1. Growth in consumer prices is expected to slow to a 3.0% pace in 2024 and 2.3% in 2025, both higher than last month’s survey.
- Sticky inflation has led to recent comments from the Fed suggesting that rates may stay higher for longer than expected at the beginning of this year. Expectations for 10-year Treasury yields were slightly higher for 2024 and 2025 as expected rate cuts get pushed back.
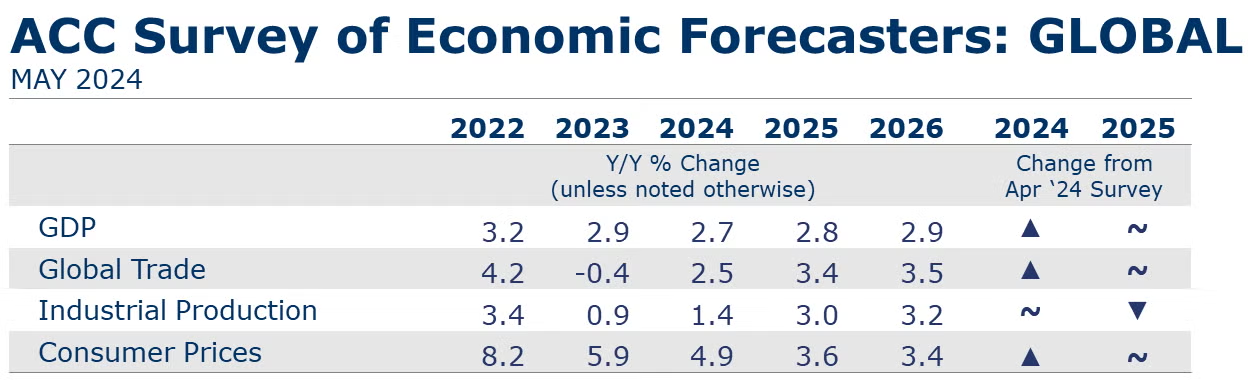
- Global GDP growth was revised up to 2.7% for 2024. The 2025 global growth forecast was unchanged at 2.8%. Global activity is forecast to expand at a 2.9% pace in 2026.
- Global inflation pressures have eased since 2022. Inflation will continue to moderate, advancing at a 4.9% pace this year and further easing toward an average 3.2% pace over the 2027-2031 period.
- Global manufacturing was weak and lacked momentum through 2023, expanding by less than 1% over the year. Growth will return as demand recovers. The industrial sector is forecast to grow 1.4% this year and pick up to a 3.0% pace in 2025.
- Relatively weak demand for manufactured goods was observed throughout the past year in flat or falling new orders – both domestic and export. Muted external demand for industrial goods hampered world trade volumes and trade contracted in 2023. Trade volumes are forecast to recover this year by an upwardly revised 2.5% and by 3.4% in 2025.
ENERGY
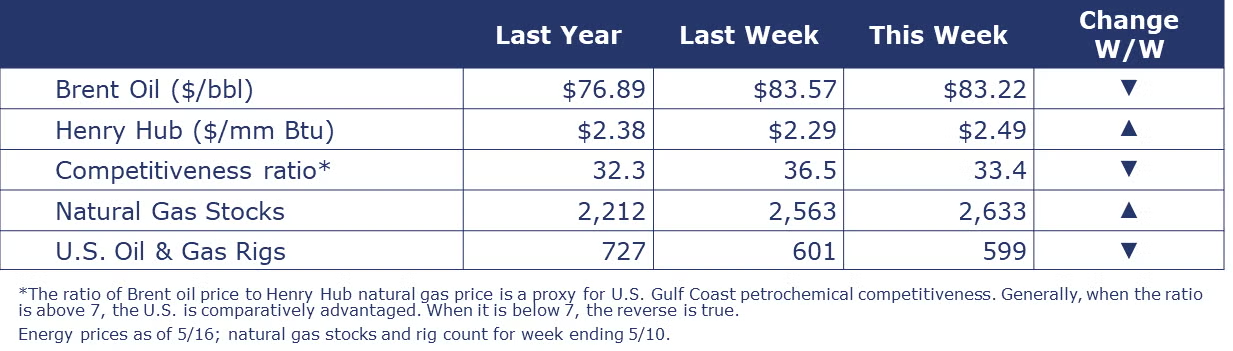
Oil prices were slightly lower following IEA cutting its oil demand growth forecast for 2024. U.S. natural gas prices continue to move higher as the summer heat (and cooling demand) starts in parts of the country. The combined oil and gas rig count eased by two to 599, the first dip below 600 since early-2022.
CHEMICALS
Indicators for the business of chemistry bring to mind a yellow banner.
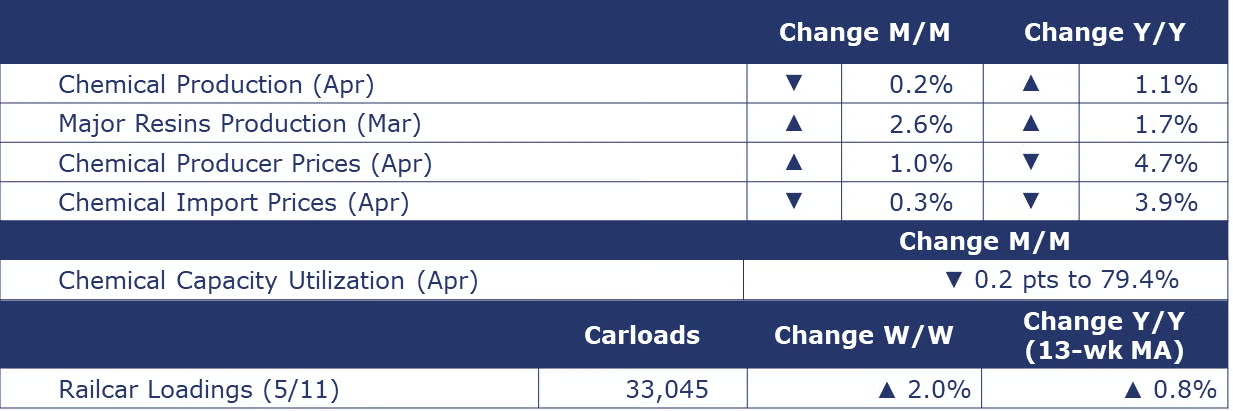
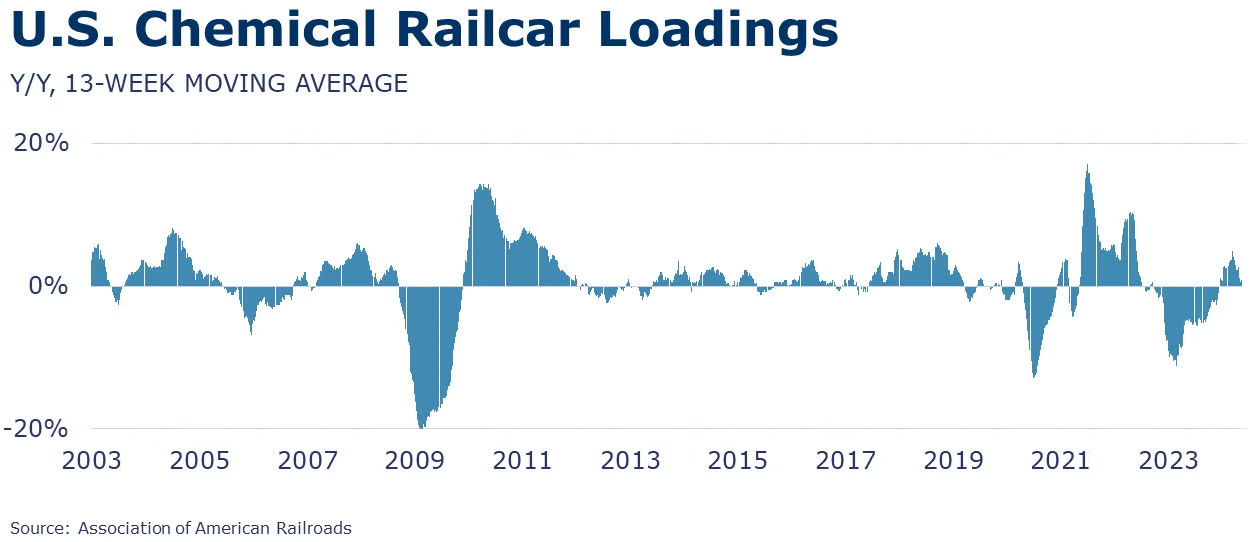
According to data released by the Association of American Railroads, chemical railcar loadings were up to 33,045 for the week ending May 11. Loadings were up 0.8% Y/Y (13-week MA), up (4.0%) YTD/YTD and have been on the rise for 7 of the last 13 weeks.
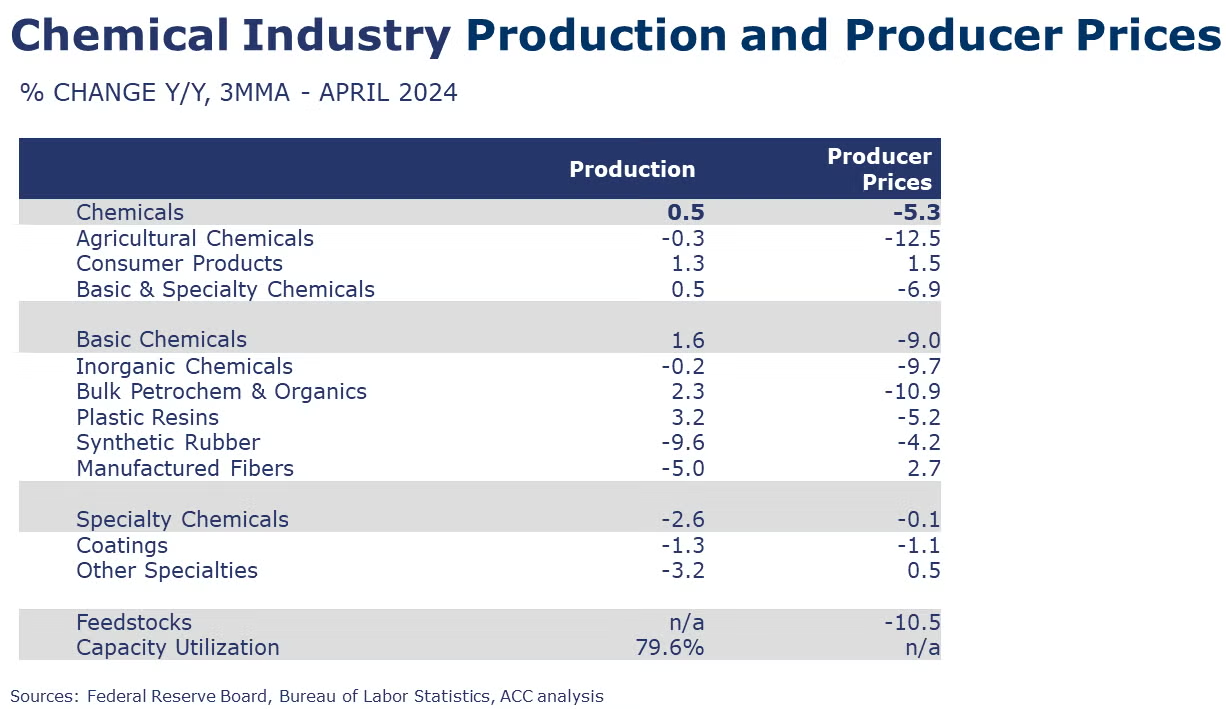
Chemical producer prices rose 1.0% in April, the third monthly gain in a row and the largest monthly gain in nearly two years. Gains were broad-based with improvement across nearly all categories. The largest percentage gains were in synthetic rubber, petrochemicals & organics, and plastic resins. Prices were lower for manufactured fibers and coatings. Compared to a year ago, chemical prices were 4.7% lower.
Chemical production moved lower in April, off by 0.2%. There were gains in the output of inorganic chemicals, consumer products and other specialty chemicals that were offset by declining output volumes for organic chemicals, synthetic materials, coatings, and agricultural chemicals. Chemical capacity utilization fell 0.2 points to 79.4%. This was slightly higher than last April’s 79.1% capacity utilization rate.
U.S. production of major plastic resins totaled 8.6 billion pounds during March, up 2.6% compared to the prior month, and up 1.7% Y/Y. Sales and captive (internal) use of major plastic resins totaled 8.3 billion pounds, down 0.3% M/M and up 3.2% Y/Y.
U.S. chemical import prices declined by 0.3% in April following two months of softening. Prices were down 3.9% year over year. U.S. chemical export prices moved up by 0.4%. Compared to a year ago, chemical export prices were 2.5% lower.
Note On the Color Codes
Banner colors reflect an assessment of the current conditions in the overall economy and the business chemistry of chemistry. For the overall economy we keep a running tab of 20 indicators. The banner color for the macroeconomic section is determined as follows:
Green – 13 or more positives
Yellow – between 8 and 12 positives
Red – 7 or fewer positives
There are fewer indicators available for the chemical industry. Our assessment on banner color largely relies upon how chemical industry production has changed over the most recent three months.
For More Information
ACC members can access additional data, economic analyses, presentations, outlooks, and weekly economic updates through ACCexchange.
In addition to this weekly report, ACC offers numerous other economic data that cover worldwide production, trade, shipments, inventories, price indices, energy, employment, investment, R&D, EH&S, financial performance measures, macroeconomic data, plus much more. To order, visit http://store.americanchemistry.com/.
Every effort has been made in the preparation of this weekly report to provide the best available information and analysis. However, neither the American Chemistry Council, nor any of its employees, agents or other assigns makes any warranty, expressed or implied, or assumes any liability or responsibility for any use, or the results of such use, of any information or data disclosed in this material.
Contact us at ACC_EconomicsDepartment@americanchemistry.com.

