MACROECONOMY & END-USE MARKETS
Running tab of macro indicators: 9 out of 20
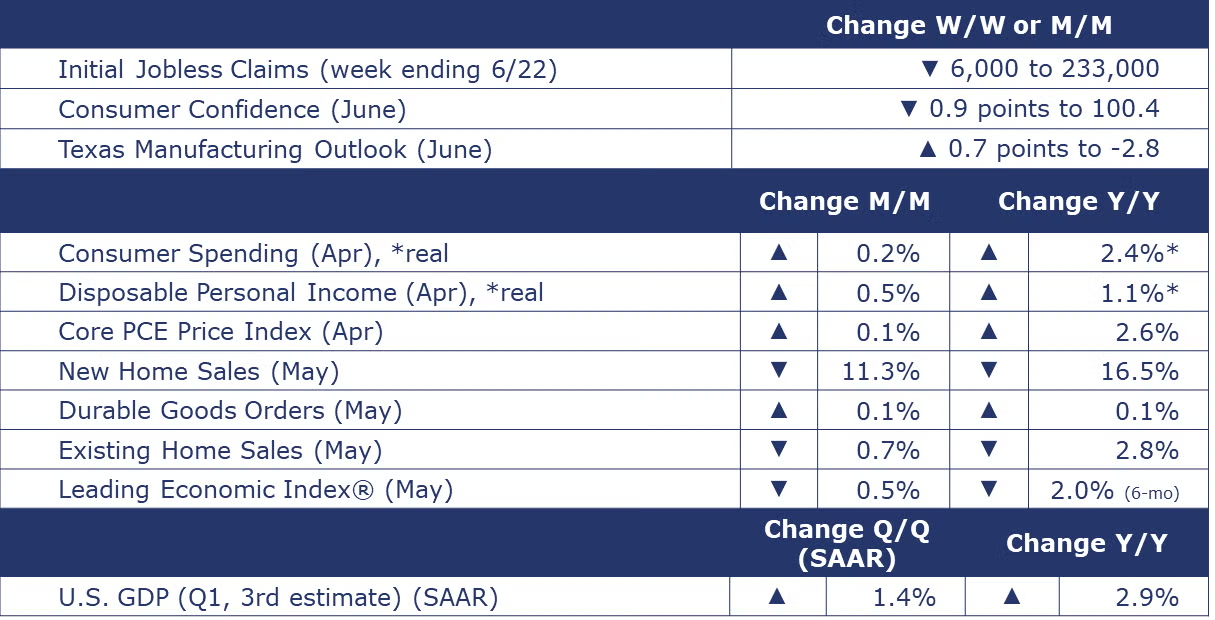
The number of new jobless claims fell by 6,000 to 233,000 during the week ending June 22. Continuing claims increased by 18,000 to 1.839 million, and the insured unemployment rate for the week ending June 15 was unchanged at 1.2%.
Consumer spending continued to expand in May, up by 0.2%, slightly weaker than expected. While spending on goods increased (for both durable and nondurable goods), spending on services drove much of May’s increase. Disposable personal income (fueling the ability to spend) was up 0.5%, reflecting continued gains in wages and salaries. The savings rate moved higher to 3.9%, its highest level since January, but below its long-term average. As consumers become more concerned about the future, they tend to save more of their income.
Inflation continued to moderate in May. The annual growth in the price index for personal consumption expenditures (PCE) eased to 2.6%. While prices for goods were essentially flat (compared to a year ago), services prices remain elevated, reflecting (in part) higher wages. Excluding food and energy, growth in the core PCE price index also moved lower from 2.8% in April (where it had been stuck for three months) to 2.6% in May.
Consumer confidence dipped in June, down 0.9 points to 100.4. Consumer’s assessment of their current condition improved, but their short-term outlook for income, business, and labor market conditions deteriorated. Plans to purchase a home were largely unchanged and remained near historic lows, however, plans to purchase large appliances and smartphones increased slightly. Buying plans for cars stalled and fewer consumers planned to buy a laptop or PC. The share of consumers planning a vacation over the next six months continued to increase. The trend toward consuming services (like vacation travel) versus goods has contributed to lower demand for chemicals and other materials.
Led by lower new orders, weak consumer sentiment, and lower building permits, the Conference Board’s Leading Economic Index® (LEI) declined 0.5% in May and was down 2.0% for the six months ending May. The index for industrial production improved and was the largest positive contributor to the headline LEI. The LEI signals weakening growth in the short-term but does not signal a recession.
The BEA’s third estimate of Q1 GDP growth came in at 1.4% on a seasonally adjusted annual rate (SAAR), a downshift from 3.4% growth over Q4 2023. The upward revision primarily reflects a downward revision to imports and an upward revision to nonresidential fixed investment and government spending. These revisions were partly offset by a downward revision to consumer spending.
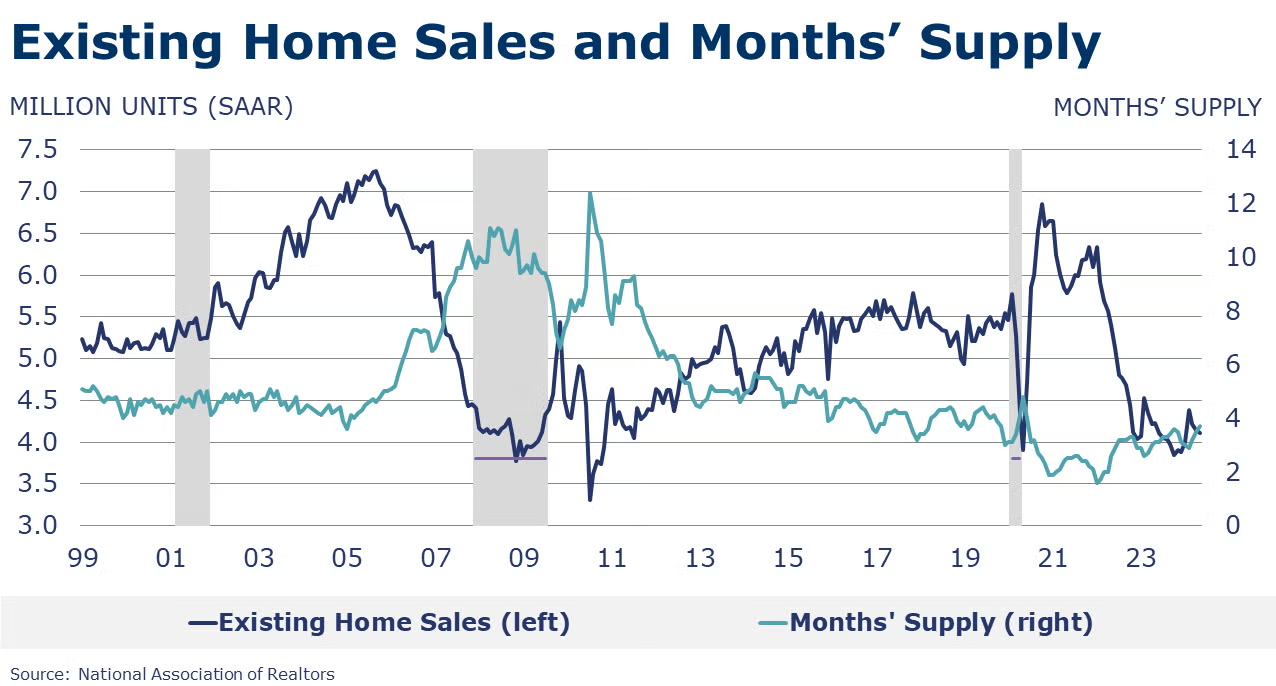
Existing home sales declined 0.7% in May to a 4.11 million annual pace which was off 2.8% Y/Y. Compared to last year, sales were higher in every U.S. region for homes priced at $500k and higher while sales were down across all regions for homes priced $250k and lower. Homes priced $100k and lower are sitting on the market more than a week longer than higher priced homes. Housing inventories rose in May to a 3.5-month supply which was up from a 2.9-month supply a year ago. The median sales price was up 5.8% Y/Y to $419,300 in May.
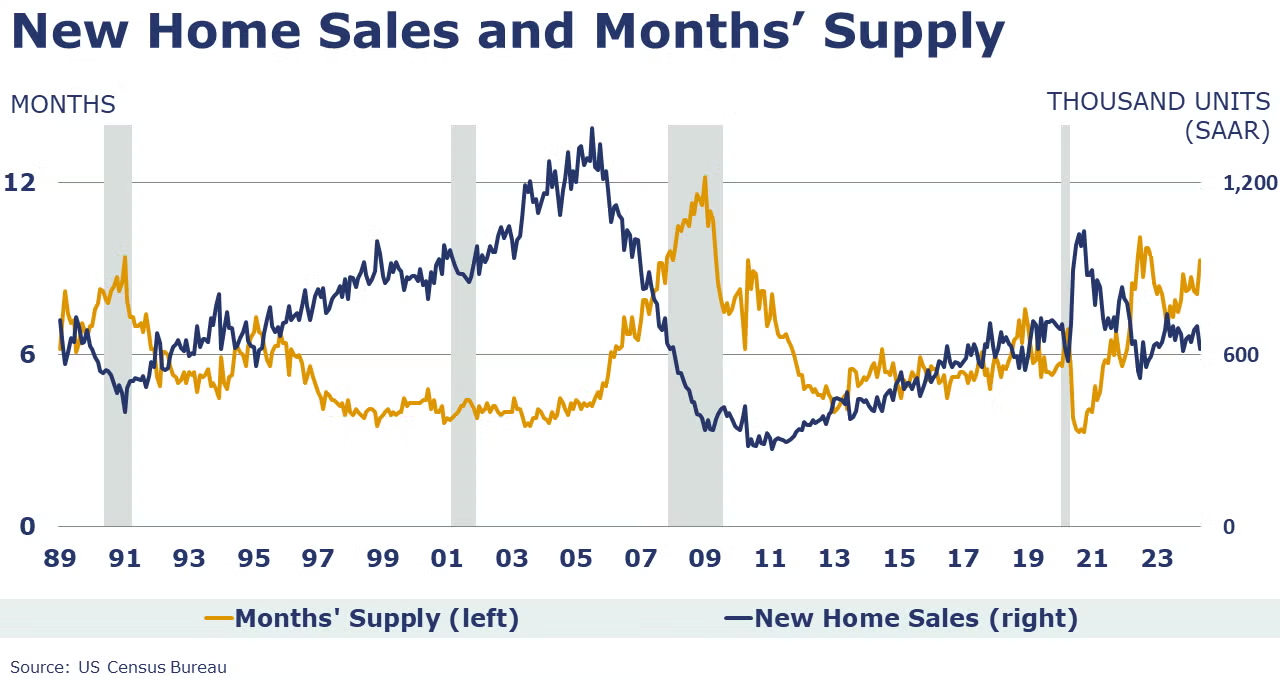
New home sales fell 11.3% to a 619,000 seasonally adjusted annual rate in May. The number of unsold homes available for sale rose 1.5% to 481,000, a high and representing a 9.3-month supply of new homes for sale. A year ago, months’ supply was 6.9. The median sales price of new homes sold in May was $417,400, down slightly from April and lower than the 2023 annual median price of $428,600.
Growth in durable goods orders was flat (up just 0.1%) in May, following three months of decelerating gains. Excluding defense, new orders were down 0.2%. Transportation equipment led the May gain with increases in new orders of autos and parts and defense aircraft. Orders were also higher for computers and electronics (including semiconductors) and fabricated metal products. Orders for core business goods (nondefense capital goods excluding aircraft) fell 0.6%. Compared to a year ago, headline orders were up 0.1% while core business orders were up by 0.9%.
Manufacturing activity in Texas stabilized in June according to the Dallas Fed Manufacturing Outlook Survey. Production and shipments rose slightly while new orders and employment remained down. Prices paid for raw material prices and wages continued to grow. Manufacturers were optimistic about their company’s outlook and general business activity six months ahead.
Manufacturing activity in the Fifth District, which includes the District of Columbia, Maryland, North Carolina, South Carolina, Virginia, and most of West Virginia, deteriorated over June. Shipments and new orders declined. Employment also fell though at a slower pace than the month before. Firms continue to expect improvement in conditions and activity over the next six months. Wages and prices paid continue to build but firms expect moderation later this year.
Factory activity in the Kansas City Fed’s region fell moderately in June. Production, new orders, and labor count were down. Overall, expectations for future activity remain expansionary.
ENERGY

Oil prices were higher this past week as an increase in tensions between Israel and Iran-backed Hezbollah are creeping into supply concerns. U.S. natural gas prices were slightly lower this week despite the heatwave. Natural gas inventories continued to build. The combined oil and gas rig count fell for a third consecutive week, down by three to 583.
CHEMICALS
Indicators for the business of chemistry suggest a yellow banner.
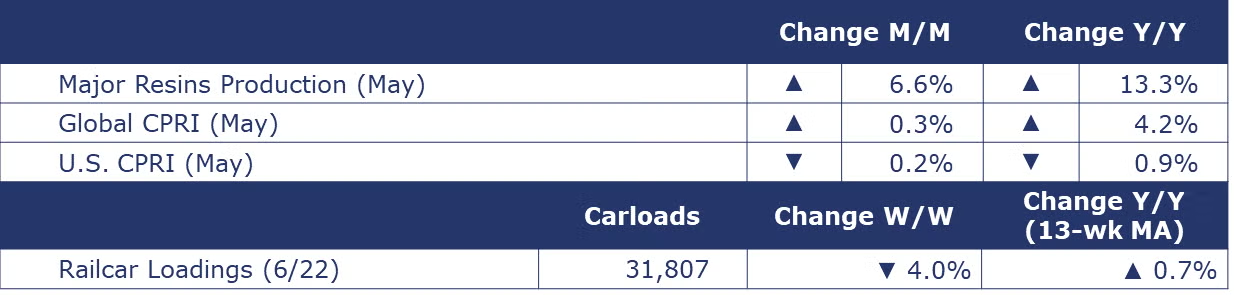
According to data released by the Association of American Railroads, chemical railcar loadings were down to 31,807 for the week ending June 22. Loadings were up 0.7% Y/Y (13-week MA), up (4.3%) YTD/YTD and have been on the rise for 7 of the last 13 weeks.

Following a 0.3% gain in April, ACC’s Global Chemical Production Regional Index (Global CPRI) rose by another 0.3% in May. Significant growth was observed in South America and Asia, while other regions declined. China made the most important contribution, as demand for chemicals and plastics rose. Taiwan, Korea, and Germany also saw improvements. All segments grew, with agricultural chemicals gaining and accelerating. Global chemicals production growth was up 4.2% Y/Y.
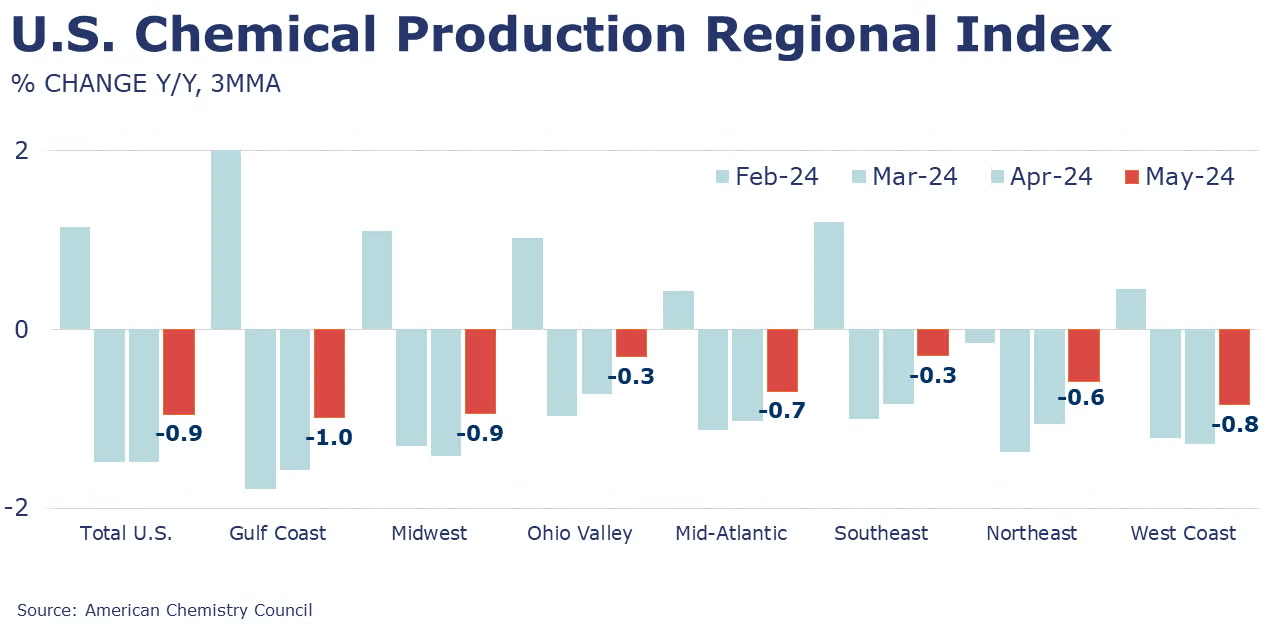
Following a small gain in April, the U.S. CPRI retreated in May, down 0.2%. The U.S. CPRI measures chemical production trends on a three-month moving average (3MMA) to smooth month-to-month volatility. Chemical production eased across all regions in May. The largest declines were in the Gulf Coast, Ohio Valley, and Southeast regions. Compared to a year ago, the U.S. CPRI was down 0.9%.
According to ACC, U.S. production of major plastic resins totaled 8.7 billion pounds during May 2024, an increase of 6.6% compared to the prior month, and an increase of 13.3% Y/Y. Year-to-date production was 41.9 billion pounds, a 6.2% increase as compared to the same period in 2023. Sales and captive (internal) use of major plastic resins totaled 8.6 billion pounds during May 2024, an increase of 2.2% compared to the prior month, and an increase of 9.1% from the same month one year earlier. Year-to-date sales and captive use were 41.9 billion pounds, a 9.1% increase as compared to the same period in 2023.
Note On the Color Codes
Banner colors reflect an assessment of the current conditions in the overall economy and the business chemistry of chemistry. For the overall economy we keep a running tab of 20 indicators. The banner color for the macroeconomic section is determined as follows:
Green – 13 or more positives
Yellow – between 8 and 12 positives
Red – 7 or fewer positives
There are fewer indicators available for the chemical industry. Our assessment on banner color largely relies upon how chemical industry production has changed over the most recent three months.
For More Information
ACC members can access additional data, economic analyses, presentations, outlooks, and weekly economic updates through ACCexchange.
In addition to this weekly report, ACC offers numerous other economic data that cover worldwide production, trade, shipments, inventories, price indices, energy, employment, investment, R&D, EH&S, financial performance measures, macroeconomic data, plus much more. To order, visit http://store.americanchemistry.com/.
Every effort has been made in the preparation of this weekly report to provide the best available information and analysis. However, neither the American Chemistry Council, nor any of its employees, agents or other assigns makes any warranty, expressed or implied, or assumes any liability or responsibility for any use, or the results of such use, of any information or data disclosed in this material.
Contact us at ACC_EconomicsDepartment@americanchemistry.com.

