MACROECONOMY & END-USE MARKETS
Running tab of macro indicators: 9 out of 20
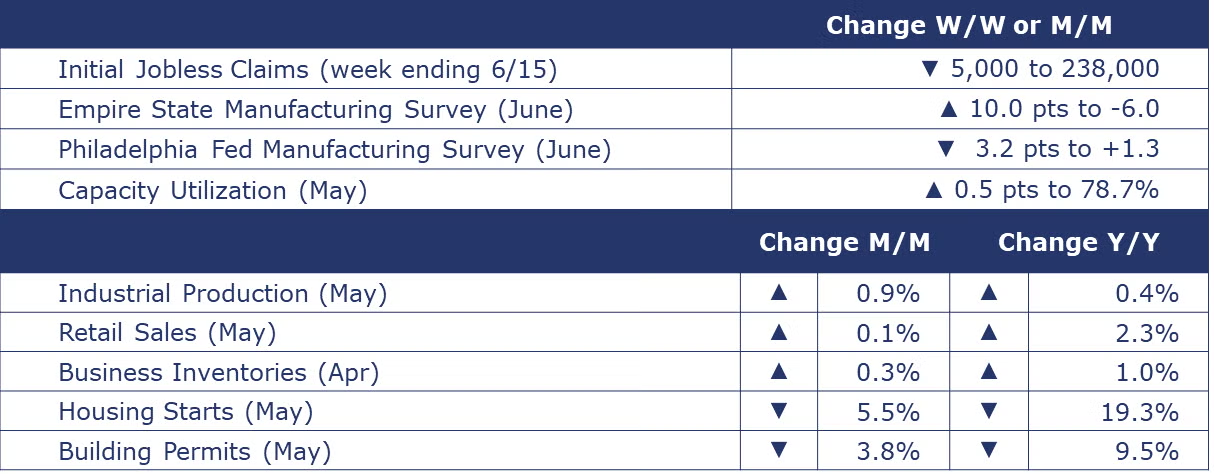
The number of new jobless claims fell by 5,000 to 238,000 during the week ending June 15. Continuing claims increased by 15,000 to 1.83 million, and the insured unemployment rate for the week ending June 8 was unchanged at 1.2%.
Following a small decline in April, retail sales edged slightly higher by 0.1% in May, disappointing expectations for a larger gain. Excluding autos, retail sales were down 0.1%. Declines in sales at furniture and home furnishings stores, building materials & garden centers, gas stations, restaurants, and food & beverage stores were offset by gains in other categories. Retail sales were up 2.3% Y/Y.
Following a small decline in March, combined business inventories rose by 0.3% in April. There was a large build in retail inventories and smaller builds among wholesalers and manufacturers. Business sales also rose by 0.3% in April. As a result, the inventories-to-sales ratio remained steady for a third month at 1.37. Business inventories were up by 1.0% while sales were 2.2% higher.
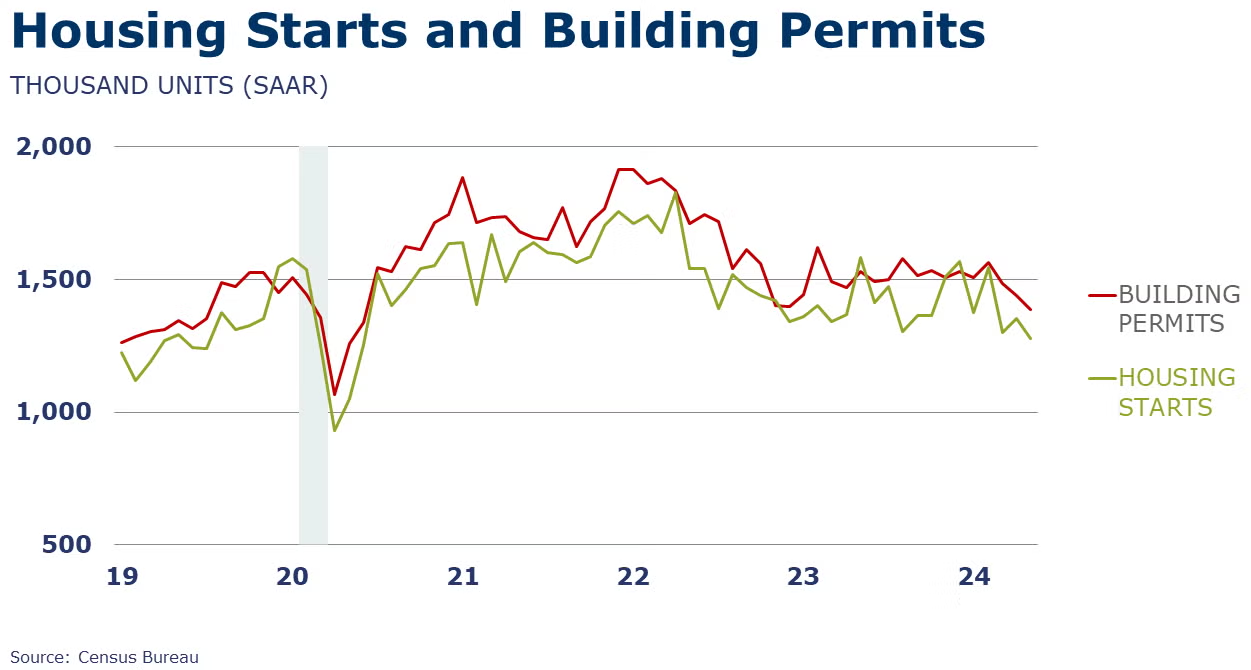
With the 30-year fixed mortgage rate above 7% for much of the month, housing starts fell 5.5% in May with declines in both single-family and multi-family units. Housing starts retreated to a 1.28 million seasonally adjusted annual pace, the slowest since June 2020. New residential building activity weakened in all regions except the West. Forward-looking building permits were also lower, off by 3.8%. Compared to a year ago, housing starts were down 19.3% Y/Y while building permits were off 9.5% Y/Y.
Separately, builder confidence weakened in May as mortgage rates continue to challenge affordability. The NAHB/Wells Fargo Housing Market Index fell for a second consecutive month to 43, suggesting homebuilders are increasingly pessimistic. All three components (sales, sales expectations, and buyer traffic) deteriorated.
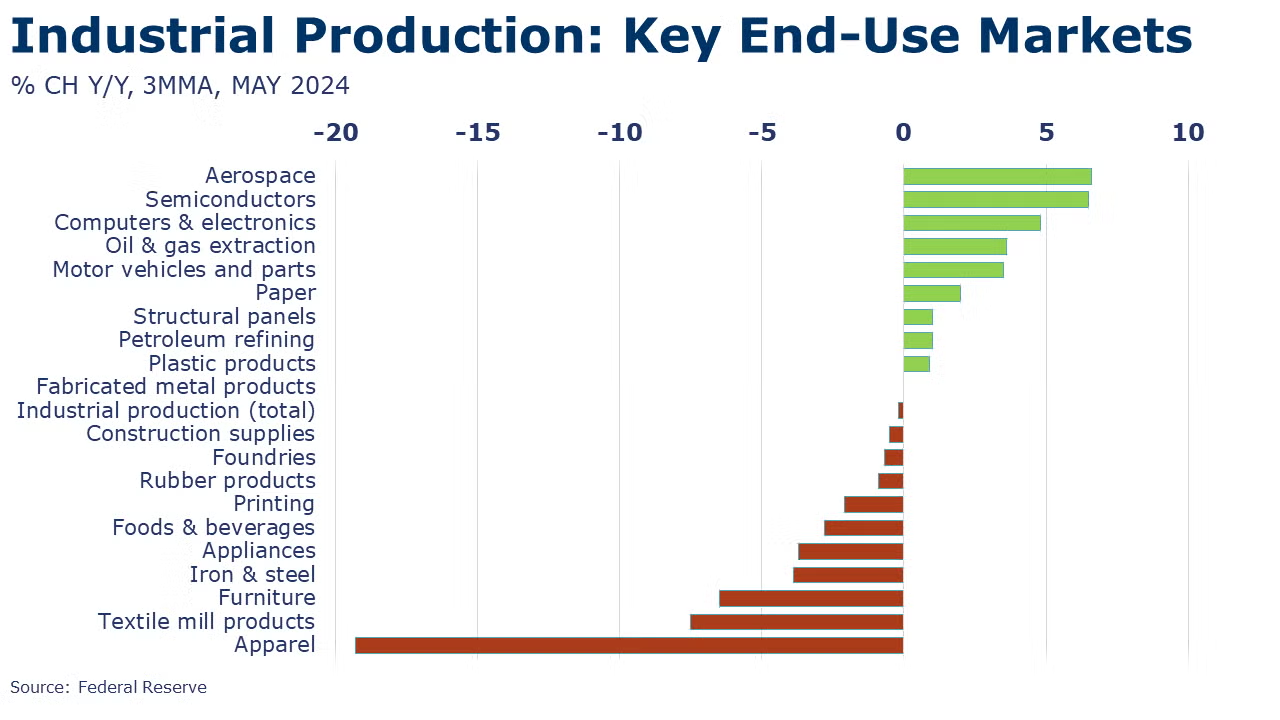
Following declines in March and April, industrial production rebounded in May, up by 0.9%, the highest monthly gain in ten months. Production rose in most major industries in May with a few exceptions, including nonmetallic mineral products, furniture, miscellaneous durable goods, and printing. The largest percentage gains were in petroleum products, wood products, machinery, chemicals, and textiles. Compared to a year ago, industrial production was up by 0.4% Y/Y. Capacity utilization rose 0.5 percentage points to 78.7%, the highest rate this year. A year ago, capacity utilization was 79.5%.
Survey of Economic Forecasters
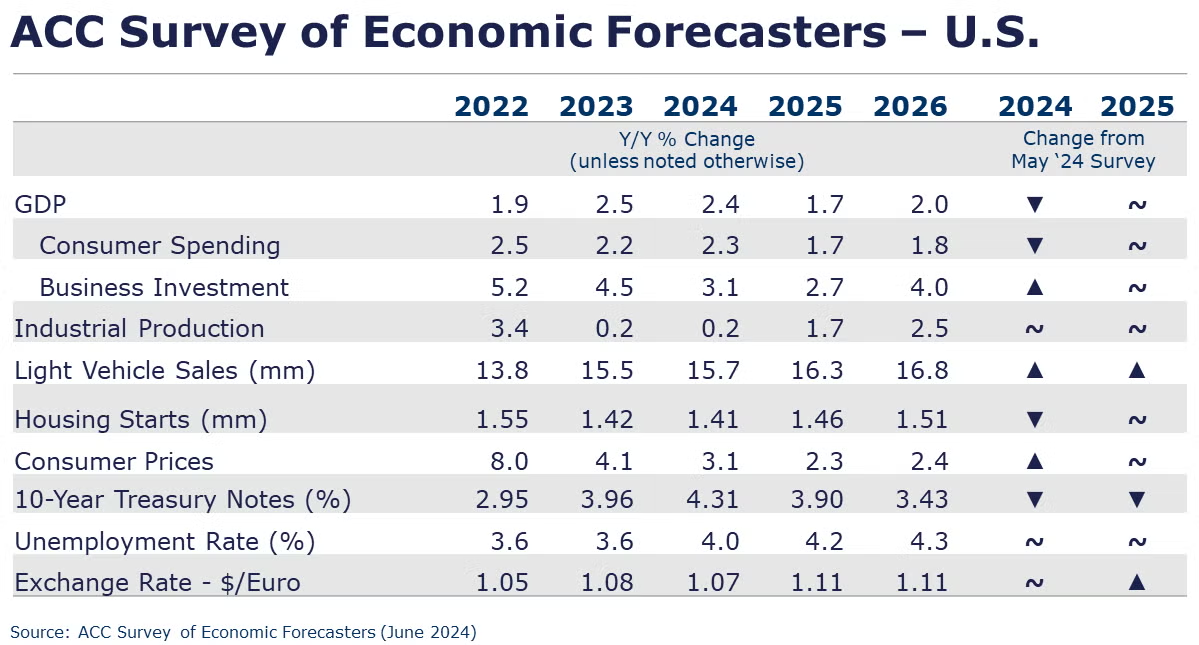
- Moving toward the end of Q2, the US economy remains on a good footing. The labor market continues to rebalance and wage growth continues to support spending.
- U.S. GDP is expected to grow by 2.4% in 2024 and by 1.7% in 2025.
- Consumer spending growth is expected to slow to a 2.3% Y/Y pace in 2024 and further to a 1.7% pace in 2025.
- Higher borrowing costs and election uncertainty have dampened business investment which is expected to decelerate to a 3.1% pace in 2024 (higher than last month’s survey) before increasing to a 2.7% gain in 2025 as interest rates decline.
- Following a 0.2% gain in 2023, we look for industrial production to come in around the same pace (0.2%) in 2024 before strengthening to a 1.7% pace in 2025.
- The pace of autos and light trucks sales is expected to rise to 15.7 million units in 2024 (still below trend) before rising to a 16.3-million-unit pace in 2025.
- Higher mortgage rates continued to dampen housing demand. Housing starts are expected to remain essentially flat at 1.41 million in 2024 before rising to a 1.46 million pace in 2025 as mortgage rates ease next year.
- The unemployment rate is expected to move higher as the labor market rebalances averaging 4.0% in 2024 and 4.2% in 2025.
- Recent data shows that inflation remains above the Fed’s target, though progress toward 2% continues. Growth in consumer prices is expected to slow a 3.1% pace in 2024 and 2.3% in 2025.
- Despite recent rate cuts by the ECB and Bank of Canada, the Fed continues to signal that it is waiting for more evidence that inflation is moving toward its target rate. Expectations for 10-year Treasury yields were slightly lower for 2024 and 2025 as there is growing confidence of rate cuts beginning this fall.
ENERGY
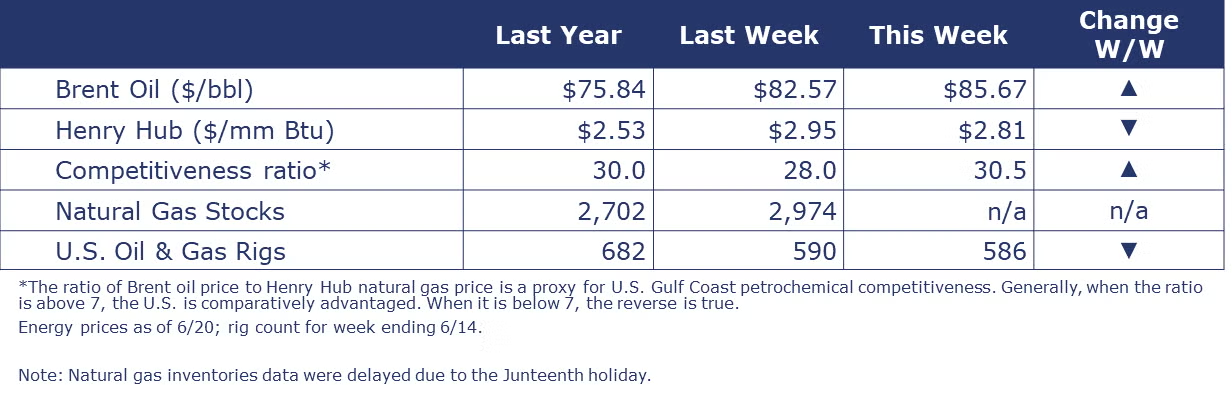
Oil prices were higher than a week ago despite some meh news on Chinese production. Expectations are rising for the summer driving season which will pull from inventories. U.S. natural gas futures were a little lower than a week ago. The US is holding robust inventories despite expectations for a hot summer. The combined oil & gas rig count fell by 4 to 586 during the week ending 14 June.
CHEMICALS
Indicators for the business of chemistry suggest a yellow banner.
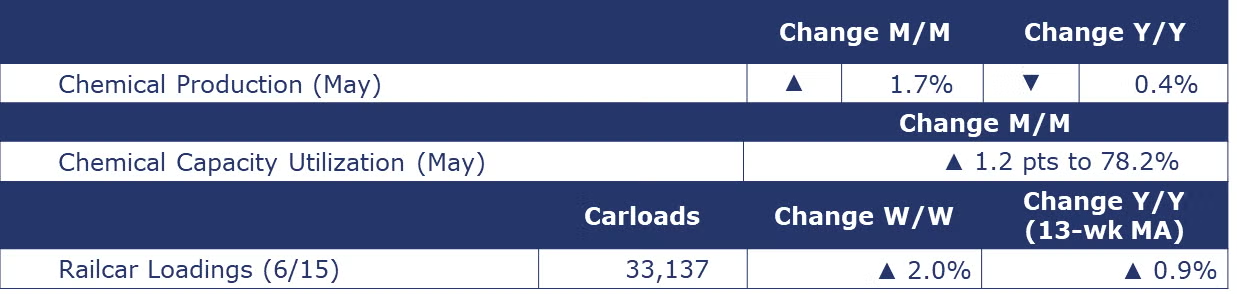
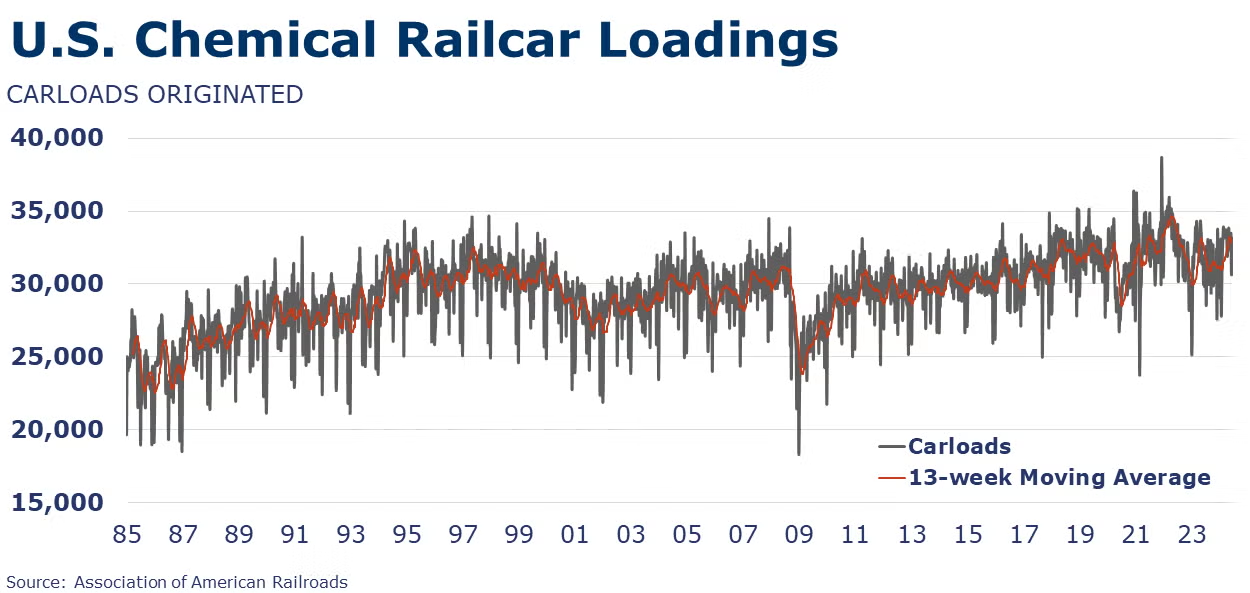
According to data released by the Association of American Railroads, chemical railcar loadings were up to 33,137 for the week ending June 15. Loadings were up 0.9% Y/Y (13-week MA), up (4.2%) YTD/YTD and have been on the rise for 8 of the last 13 weeks.
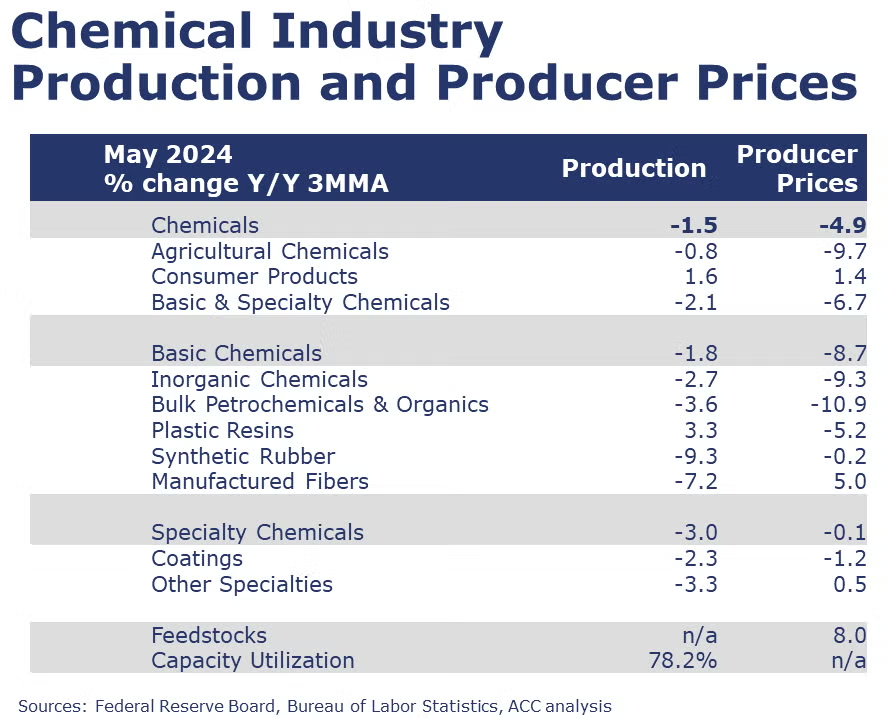
Following declines in March and April, chemical production rebounded in May, up by 1.7%. The gain reflected broad improvement across nearly all segments with the largest gains in organic chemicals, plastic resins, and fertilizers. Compared to a year ago, chemical production remained off by 0.4% Y/Y. Capacity utilization rose from 77.0% in April to 78.2% in May. Despite the gain, capacity was still lower than a year ago when it was 79.3%.
Note On the Color Codes
Banner colors reflect an assessment of the current conditions in the overall economy and the business chemistry of chemistry. For the overall economy we keep a running tab of 20 indicators. The banner color for the macroeconomic section is determined as follows:
Green – 13 or more positives
Yellow – between 8 and 12 positives
Red – 7 or fewer positives
There are fewer indicators available for the chemical industry. Our assessment on banner color largely relies upon how chemical industry production has changed over the most recent three months.
For More Information
ACC members can access additional data, economic analyses, presentations, outlooks, and weekly economic updates through ACCexchange.
In addition to this weekly report, ACC offers numerous other economic data that cover worldwide production, trade, shipments, inventories, price indices, energy, employment, investment, R&D, EH&S, financial performance measures, macroeconomic data, plus much more. To order, visit http://store.americanchemistry.com/.
Every effort has been made in the preparation of this weekly report to provide the best available information and analysis. However, neither the American Chemistry Council, nor any of its employees, agents or other assigns makes any warranty, expressed or implied, or assumes any liability or responsibility for any use, or the results of such use, of any information or data disclosed in this material.
Contact us at ACC_EconomicsDepartment@americanchemistry.com.