MACROECONOMY & END-USE MARKETS
Running tab of macro indicators: 8 out of 20
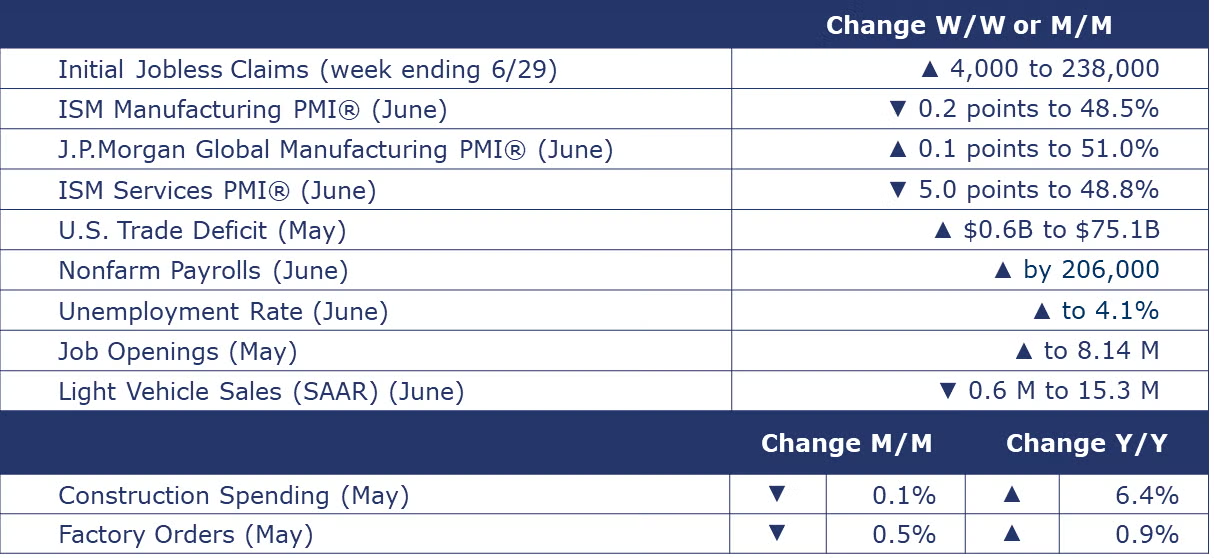
Growth in nonfarm payrolls slowed in June, up by 206,000. There were continued gains in employment in construction, government and most services industries. Manufacturing employment fell by 8,000, concentrated in durable goods (except motor vehicles). Employment in temporary help services, a bellwether, fell sharply. The average hourly wage for all workers was up 3.9% Y/Y, down from a 4.1% annual increase in May. The labor market is clearly slowing. Average monthly job growth slowed in Q2 to 177,000, down from 267,000 in Q1. Data from the separate household survey also showed growth in the labor force exceeded growth in the ranks of the employed. As a result, the number of unemployed also rose and the unemployment rate in June ticked up to 4.1%, the highest since November 2021.
The number of new jobless claims rose by 4,000 to 238,000 during the week ending June 29. Continuing claims increased by 26,000 to 1.858 million, and the insured unemployment rate for the week ending June 22 was unchanged at 1.2%.
The number of job openings rose 2.8% to 8.14 million in May, following a decline in April. Hiring also picked up modestly. In manufacturing, both openings and hires were up in May. The quits rate (a proxy for workers’ confidence in the labor market) remained steady at 2.2%. While still historically high, job openings are down compared to last year’s 9.3 million while quits were also lower than a year ago. The report suggests that the labor market remains in relatively solid shape.
Construction spending declined 0.1% in May (roughly stable) but was at a level 6.4% higher Y/Y. Residential was down 0.2% while nonresidential was down 0.1%. The overall decline in private spending offset a gain in public spending. Spending in new multifamily residential was flat while new single family construction spending fell. In the commercial sector, declines continued, and spending was down 13.0% Y/Y in May. Manufacturing construction spending rose 1.3% in May and was up 20.2% Y/Y.
Light vehicle sales fell to a 15.3 million seasonally adjusted annual pace (SAAR) in June, down from 15.9 million in May. The decline likely reflects the impact of a multi-day nationwide shutdown of dealership computer systems due to a cyberattack.
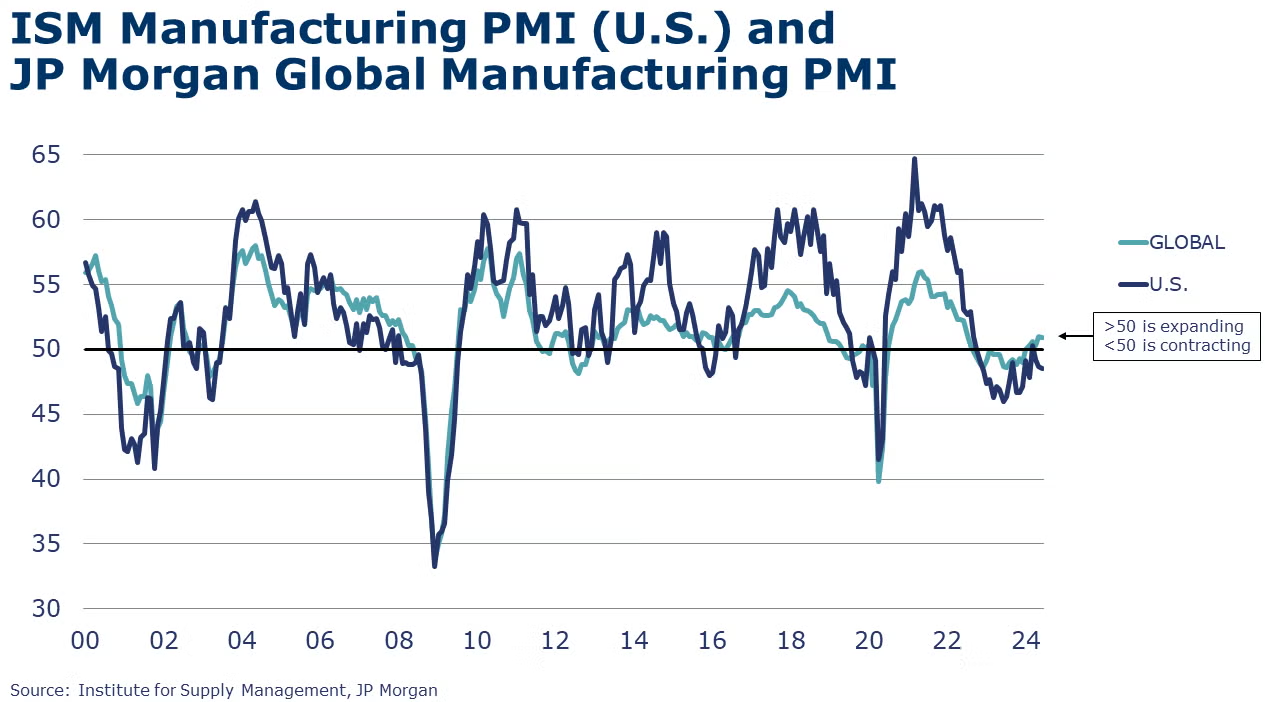
The ISM’s Manufacturing PMI® dipped 0.2 percentage points in June to 48.5%, indicating contraction for the 19th time in the past 20 months. New orders, backlogs, production and employment contracted in June. Inventories of raw materials were drawn down and customer inventories were largely described as “too low”. Manufacturers continue to navigate rising prices. Chemicals were one of the 8 industries reporting growth in June.
The J.P.Morgan Global Manufacturing PMI® declined 0.1 percentage point to 50.9 in June. The index has been above neutral (50) for 5 months, signaling sustained improvement in global manufacturing. Output grew at a slower rate with gains in consumer and intermediate goods while investment goods output fell. Just over half of nations tracked registered higher output including the US, China, and the UK. The euro area remained weak. Overall, input costs growth was at its highest rate in 16 months, pushing up selling prices. Sentiment about future output weakened but expectations for growth continued.
The ISM’s Services PMI® fell 5.0 percentage points in June to 48.8%, indicating contraction in the services sector for the second time in 3 months and the third time in 49 months. Sector activity, employment and new orders all contracted over the month.
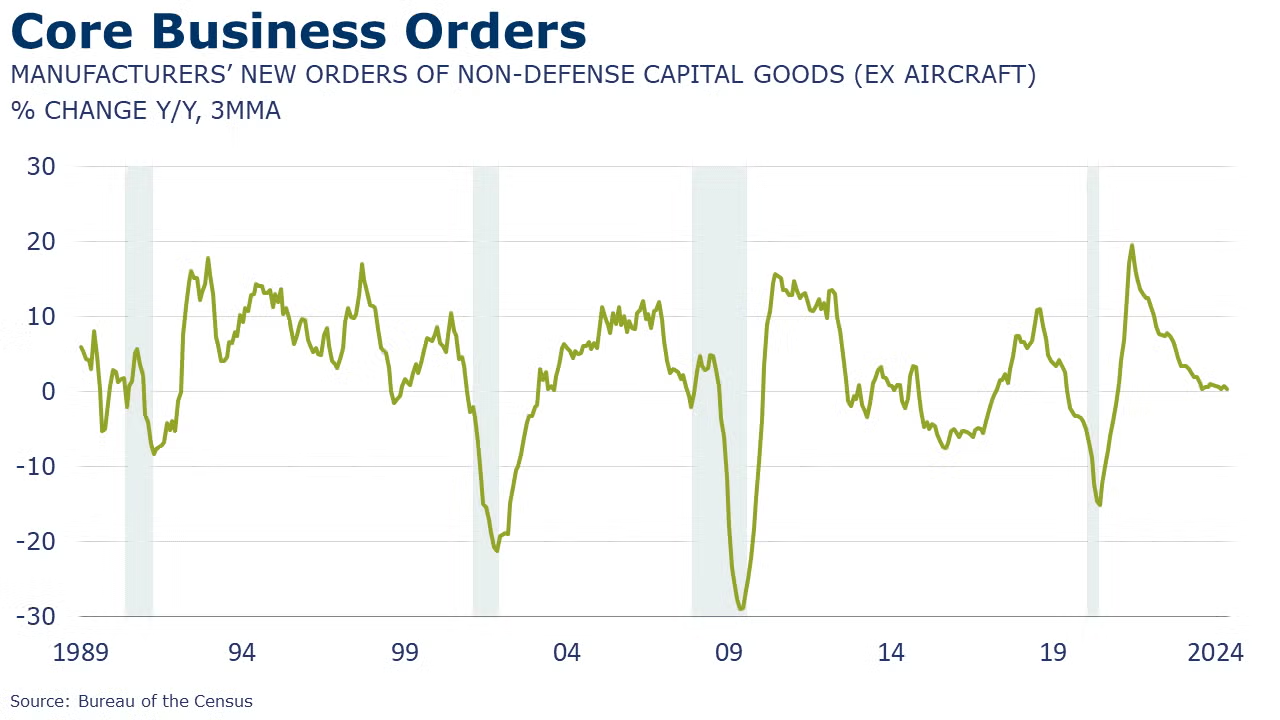
Factory orders slipped by 0.5% in May, following gains in the previous several months. Orders were lower for consumer nondurables, construction materials and IT equipment. Orders were also lower for core business goods (aka nondefense capital goods excluding aircraft). Offsetting those declines were higher orders for motor vehicles & parts, computers, defense capital goods and consumer durable goods. Headline factory orders were up 0.9% Y/Y while core orders were off by 0.3% Y/Y. Unfilled orders (a measure of the manufacturing pipeline) expanded slightly, by 0.2%. Manufacturing shipments were also lower, down by 0.7% with similar changes across major categories. Inventories were also slightly higher (up by 0.2%). Compared to a year ago, inventories were ahead by 0.8% Y/Y while shipments were up 2.2% Y/Y. The inventories-to-shipments ratio edged slightly higher to 1.47 in May compared to April but was lower than a year ago.
The U.S. trade deficit rose 0.8% in May to $75.1 billion as exports fell 0.7% and imports fell 0.3%. Exports of autos and parts and industrial supplies and materials were down. Imports of consumer goods and autos and parts fell while imports of industrial supplies and materials (including crude oil and nuclear fuel materials) increased.
ENERGY
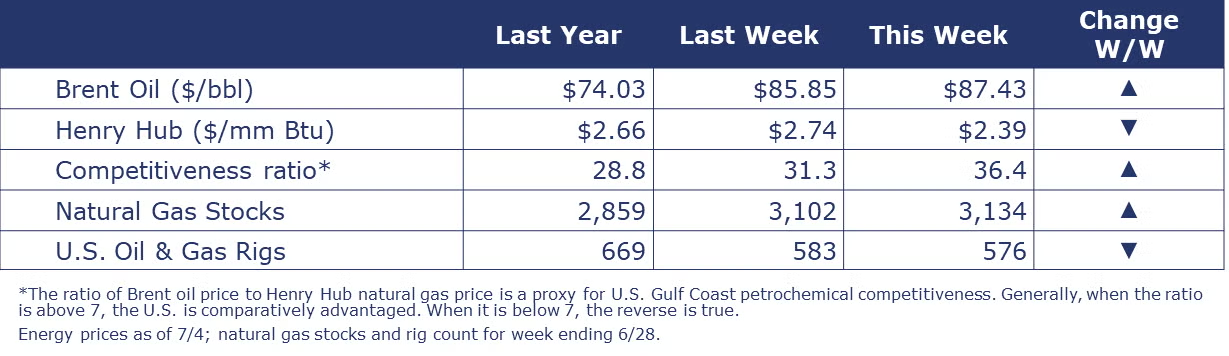
Oil prices trended higher this week as US commercial inventories declined. U.S. natural gas ended up slightly lower than a week ago as Hurricane Beryl’s current forecasted track keeps the storm away from GOM production and traders focused on ample supplies in storage. The combined rig count fell for a fourth consecutive week, down by 7 to 576.
CHEMICALS
Indicators for the business of chemistry suggest a yellow banner.
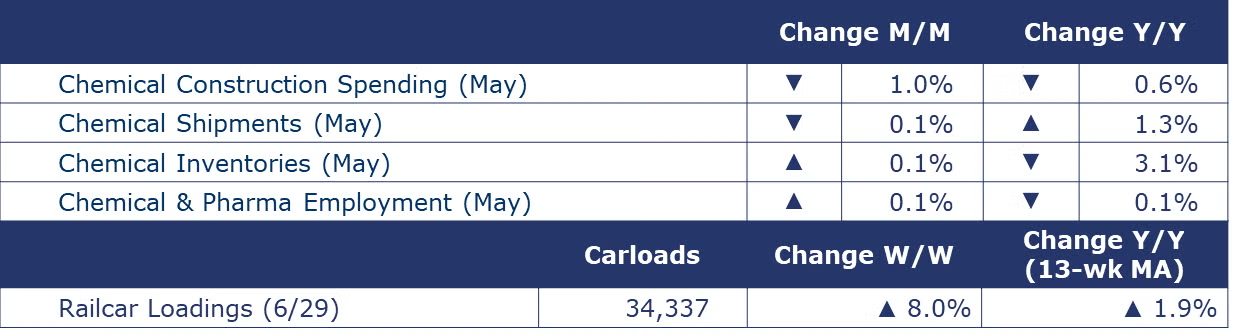
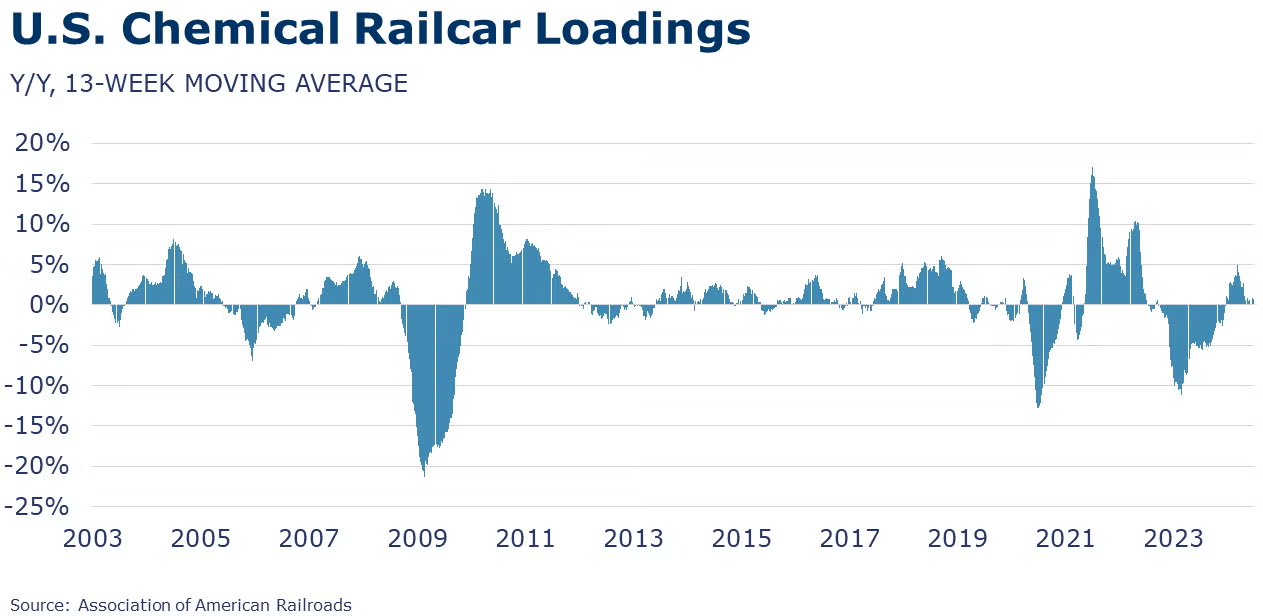
According to data released by the Association of American Railroads, chemical railcar loadings were up to 34,337 for the week ending June 29. Loadings were up 1.9% Y/Y (13-week MA), up (4.3%) YTD/YTD and have been on the rise for 8 of the last 13 weeks.
Chemicals were one of the 8 industries reporting growth in June, according to the ISM’s Manufacturing PMI® report. One chemical industry respondent reported, “High volume of customer orders”. Chemical manufacturers reported growth in new orders (including export orders) and amongst the six largest manufacturing sectors, chemicals were the only one to report increased production. A decrease in employment in June was reported. Supplier delivery performance was slower in June. Customers’ inventories were reported as “too low”. Prices paid for raw materials rose. Order backlogs were down.

Chemical industry construction spending dipped 1.0% in May and was down 0.6% Y/Y. On a 3-month-moving-average basis (3MMA), spending has been rising, returning toward 2015 strong levels. Chemicals represent about 16% of total construction spending.
Chemical shipments edged lower in May following three months of gains. Shipments were down 0.1% to $53.2 billion, with gains in shipments of agricultural chemicals offsetting declines in coatings & adhesives and all other chemicals. Chemical inventories edged slightly higher, up by 0.1%. Gains in inventories of agricultural chemicals and coatings & adhesives offset a small decline in inventories of all other chemicals. The inventories-to-shipments ratio remained stable at 1.20 for a third month. During May 2023, the ratio was 1.25. Compared to a year ago, chemical shipments were 1.3% higher while inventories were 3.1% lower.
Chemical and pharmaceutical industry employment edged slightly higher in June, up by 0.1% (600). The number of production workers rose, but the gain was nearly offset by the decline in supervisory and non-production workers. Average hourly wages rose by 3.3% Y/Y, down from a 4.5% Y/Y gain in May. The average workweek fell by 12 minutes to 41.9 hours, but with the strong gain in production workers, the labor input into the chemical industry rose, consistent with the ISM Manufacturing PMI® assessment that the chemical industry expanded in June.
Note On the Color Codes
Banner colors reflect an assessment of the current conditions in the overall economy and the business chemistry of chemistry. For the overall economy we keep a running tab of 20 indicators. The banner color for the macroeconomic section is determined as follows:
Green – 13 or more positives
Yellow – between 8 and 12 positives
Red – 7 or fewer positives
There are fewer indicators available for the chemical industry. Our assessment on banner color largely relies upon how chemical industry production has changed over the most recent three months.
For More Information
ACC members can access additional data, economic analyses, presentations, outlooks, and weekly economic updates through ACCexchange.
In addition to this weekly report, ACC offers numerous other economic data that cover worldwide production, trade, shipments, inventories, price indices, energy, employment, investment, R&D, EH&S, financial performance measures, macroeconomic data, plus much more. To order, visit http://store.americanchemistry.com/.
Every effort has been made in the preparation of this weekly report to provide the best available information and analysis. However, neither the American Chemistry Council, nor any of its employees, agents or other assigns makes any warranty, expressed or implied, or assumes any liability or responsibility for any use, or the results of such use, of any information or data disclosed in this material.
Contact us at ACC_EconomicsDepartment@americanchemistry.com.

