MACROECONOMY & END-USE MARKETS
Running tab of macro indicators: 8 out of 20
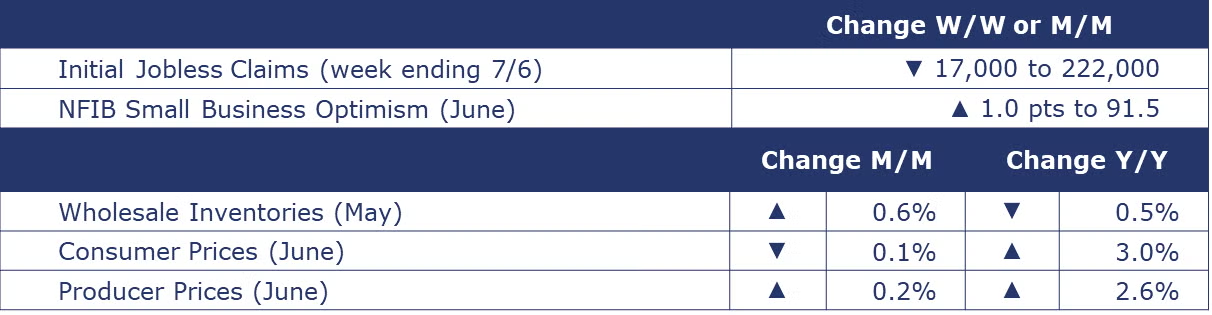
The number of new jobless claims fell by 17,000 to 222,000 during the week ending July 6. Continuing claims fell by 4,000 to 1.852 million, and the insured unemployment rate for the week ending June 29 was unchanged at 1.2%.
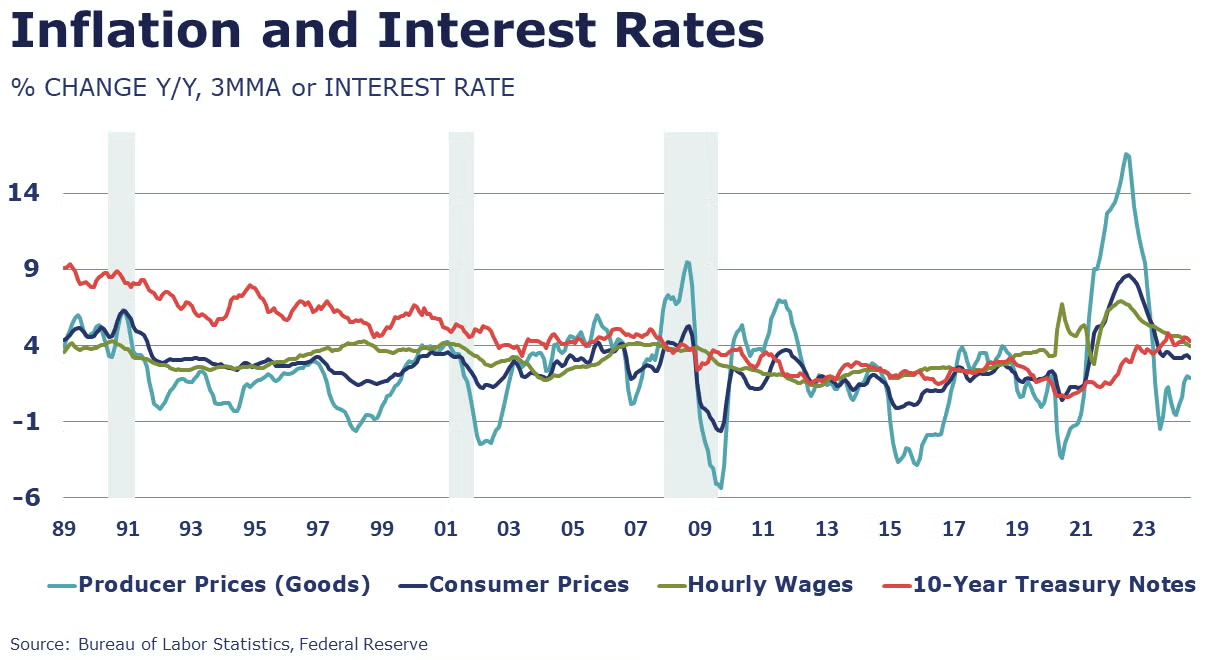
The consumer price index (CPI) eased by 0.1% in June, the first monthly decline since the early days of the pandemic. Excluding food and energy, core consumer prices were up by a modest 0.1%. Headline consumer prices were up 3.0% Y/Y while core consumer prices rose 3.3% Y/Y. The annual growth in prices for services (less energy) remains elevated, however, at 5.1% Y/Y. This category includes not only the much debated “owners’ equivalent rent”, but items like car insurance, vehicle maintenance & repair, medical care, and personal services. Much of the improvement in overall inflation has come from commodities (less food and energy) which were lower by 1.8% Y/Y. The ongoing progress to cool inflation may keep the door open for a September rate cut.
The producer price index (PPI), which measures the change in prices paid to manufacturers rose in June by 0.2% following no change in May. Over the 12 months ending in June, the PPI has grown by 2.6% (up from 2.4% in May). The core PPI (prices for final demand less foods, energy, and trade services) was unchanged in June and grew 3.1% over the 12-month period.
Wholesale inventories rose by 0.6% in May following a 0.2% increase in April. The largest inventory gains were in automotive, machinery, drugs, farm products, and miscellaneous durable goods. Sales of goods at the wholesale level rose 0.4% in May, following a 0.2% gain in April. The inventories-to-sales ratio remained steady at 1.35 for a third consecutive month, lower than last year’s 1.39. Compared to a year ago, wholesale sales were up 1.9% Y/Y while inventories were off by 0.5% Y/Y.
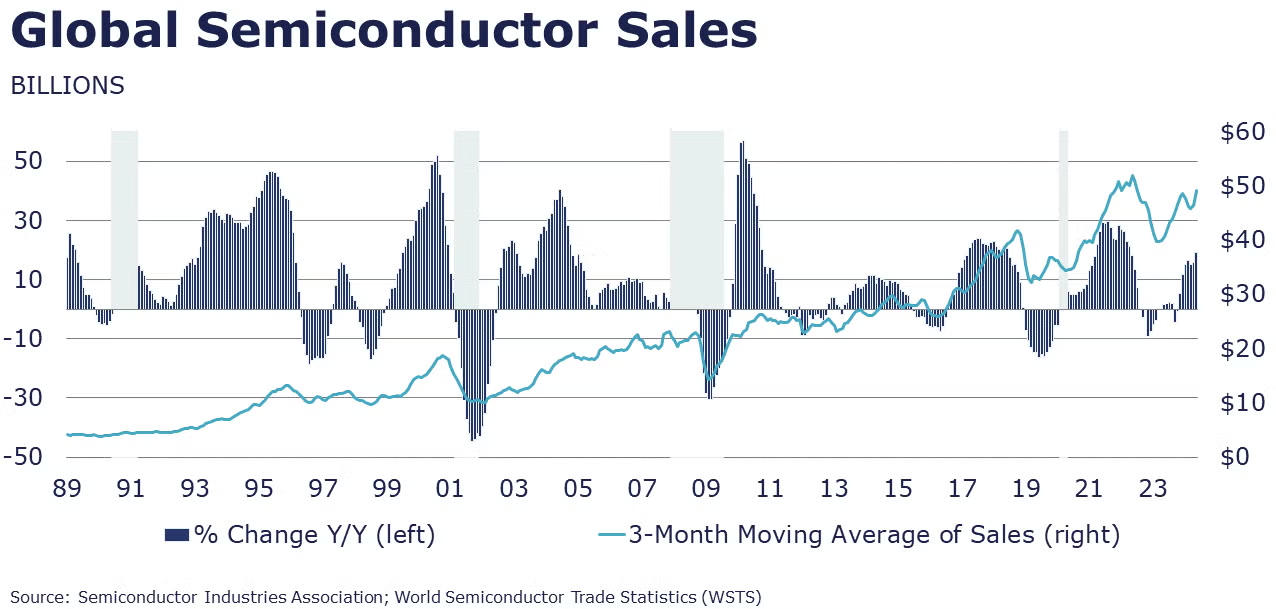
Global semiconductor sales rose 4.1% to $49.1 in May. The largest regional gain was in the Americas and sales also rose in China, Japan, and other Asia Pacific/All Other. Sales were lower in Europe. Compared to a year ago, semiconductor sales were up 19.3% Y/Y.
ENERGY
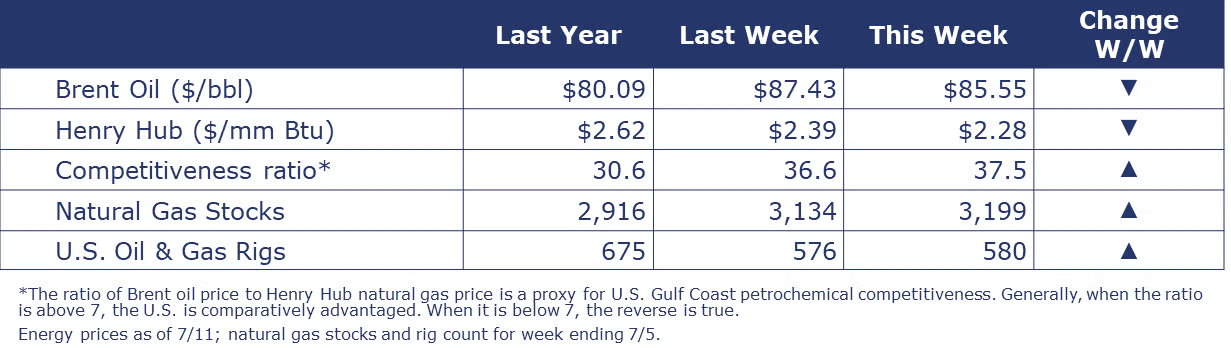
The ratio of Brent oil price to Henry Hub natural gas price - a proxy for U.S. Gulf Coast petrochemical competitiveness – pushed up to 37.5 over the past week ending July 11th. Both oil and natural gas prices eased. Natural gas stocks rose from 3,134 to 3,199 and the combined oil and gas rig count rose by four to 580 during the week ending July 5th.
CHEMICALS
Indicators for the business of chemistry suggest a yellow banner.
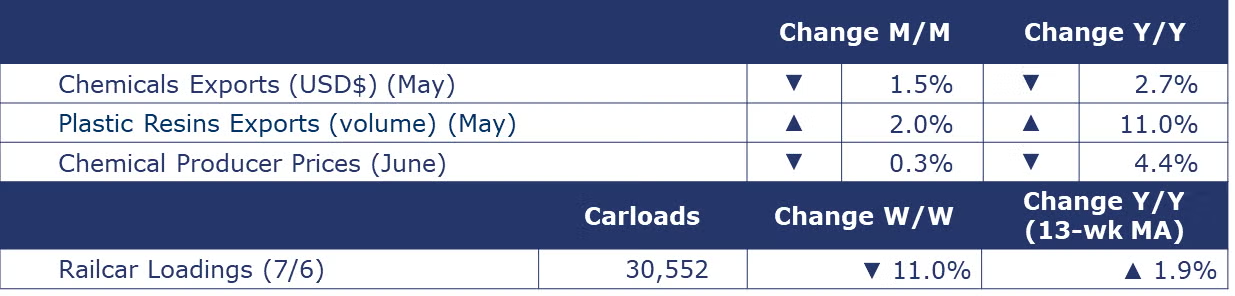
According to data released by the Association of American Railroads, chemical railcar loadings were down to 30,552 for the week ending July 6. Loadings were up 1.9% Y/Y (13-week MA), up (4.4%) YTD/YTD and have been on the rise for 8 of the last 13 weeks.
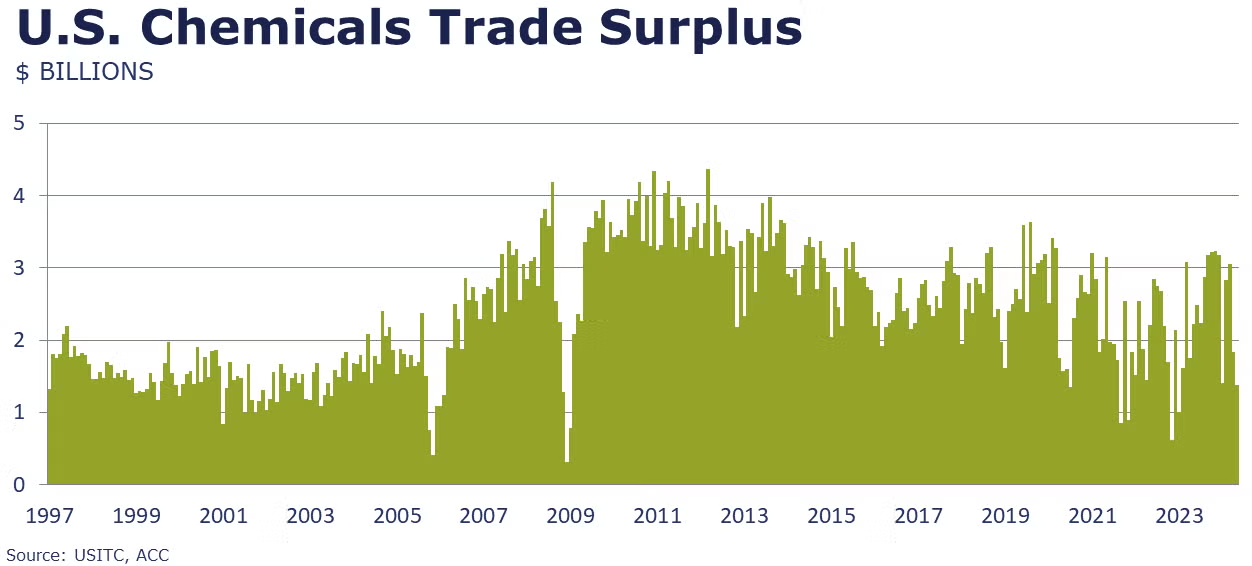
U.S. chemical exports were down 1.5% in May as an overall decline in basic chemicals offset gains in other sectors. Exports of bulk petrochemicals and intermediates were down 3.0% in May. Chemical imports rose 2.1% as imports of inorganic chemicals nearly doubled over the month. The U.S. chemicals trade surplus narrowed to $1.4 billion in May and is $10.5 billion YTD. Compared to the same month last year, exports were down 2.7% Y/Y and imports were up 4.0% Y/Y.
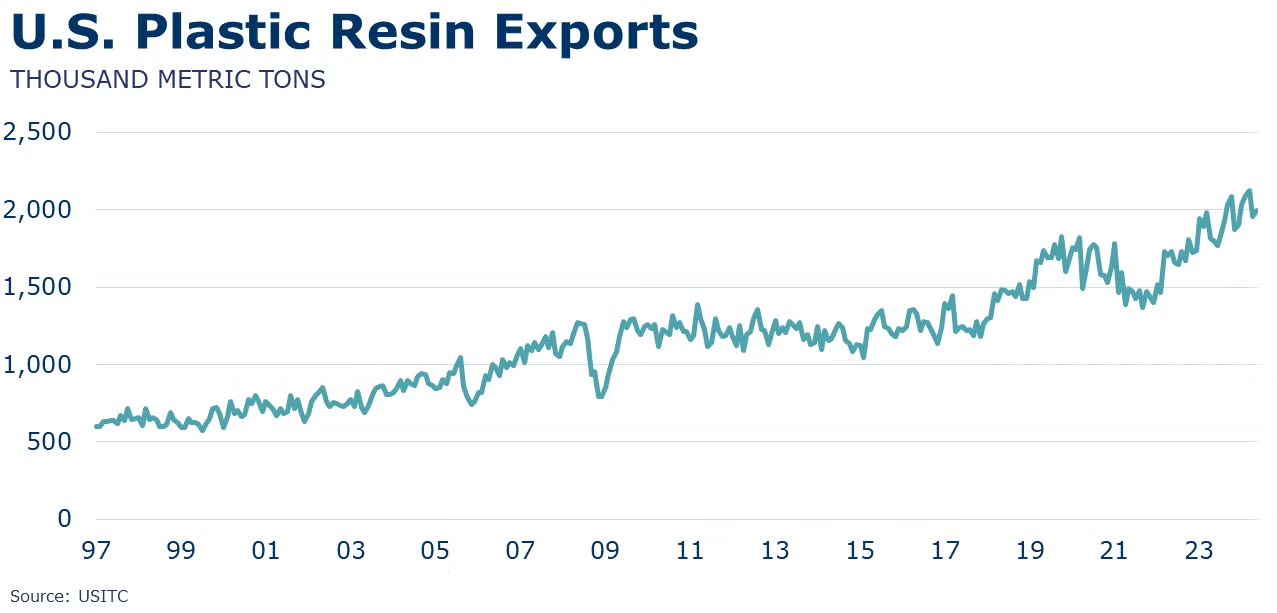
U.S. plastic resins exports were down 0.2% in May to a level up 0.7% Y/Y on a USD$ value basis. On a volume comparison, at 2.0 million metric tons exported in May, plastic resins exports were up 2.0% for the month and up 11.0% Y/Y.
Sales of chemicals at the wholesale level fell 0.7% in May to $13.0 billion. Wholesale inventories were 0.8% higher during the month. As a result, the inventories-to-sales (I/S) ratio rose from 1.11 in April to 1.13 in May. This was still lower than the 1.24 I/S ratio in May 2023. Compared to a year ago, chemical wholesale inventories were down 9.2% Y/Y while sales were off 0.8% Y/Y.
Chemical producer prices eased over June by 0.3% and were down 4.4% Y/Y. On a 3MMA and Y/Y comparison basis, prices paid on agricultural chemicals were down 7.2%, consumer products were up 1.3%, basic chemicals were down 8.1% (including plastic resins which were down 5.2%), and specialties were down 0.4%.
Note On the Color Codes
Banner colors reflect an assessment of the current conditions in the overall economy and the business chemistry of chemistry. For the overall economy we keep a running tab of 20 indicators. The banner color for the macroeconomic section is determined as follows:
Green – 13 or more positives
Yellow – between 8 and 12 positives
Red – 7 or fewer positives
There are fewer indicators available for the chemical industry. Our assessment on banner color largely relies upon how chemical industry production has changed over the most recent three months.
For More Information
ACC members can access additional data, economic analyses, presentations, outlooks, and weekly economic updates through ACCexchange.
In addition to this weekly report, ACC offers numerous other economic data that cover worldwide production, trade, shipments, inventories, price indices, energy, employment, investment, R&D, EH&S, financial performance measures, macroeconomic data, plus much more. To order, visit http://store.americanchemistry.com/.
Every effort has been made in the preparation of this weekly report to provide the best available information and analysis. However, neither the American Chemistry Council, nor any of its employees, agents or other assigns makes any warranty, expressed or implied, or assumes any liability or responsibility for any use, or the results of such use, of any information or data disclosed in this material.
Contact us at ACC_EconomicsDepartment@americanchemistry.com.

