MACROECONOMY & END-USE MARKETS
Running tab of macro indicators: 12 out of 20

The number of new jobless claims rose by 14,000 to 249,000 during the week ending July 27. Continuing claims increased by 33,000 to 1.877 million, and the insured unemployment rate for the week ending July 20 was unchanged at 1.2%.
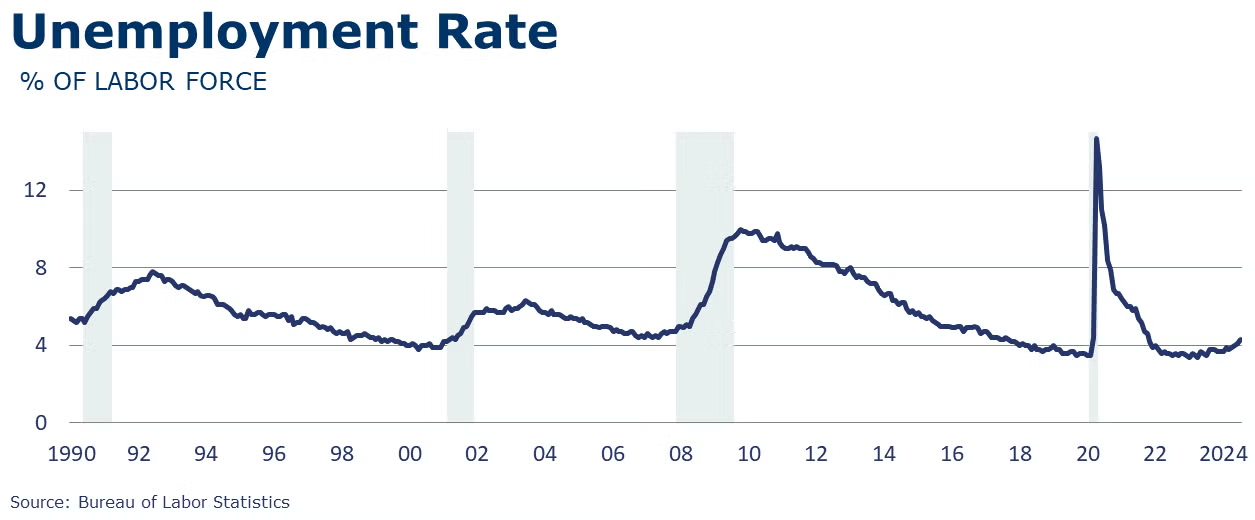
The unemployment rate rose by 0.2 percentage point to 4.3% in July and the number of unemployed people rose by 325,000 to 7.2 million. A year earlier, the jobless rate was 3.5%, and the number of unemployed people was 5.9 million.
Nonfarm payroll employment edged up by 114,000 in July, below the average monthly gain of 215,000 over the prior 12 months. Employment continued to trend up in health care, in construction, and in transportation and warehousing, while information lost jobs. Employment showed little change over the month in manufacturing.
In July, average hourly earnings for all employees on private nonfarm payrolls increased by 8 cents, or 0.2%, to $35.07. Over the past 12 months, average hourly earnings have increased by 3.6%.
The average workweek for all employees edged down by 0.1 hour to 34.2 hours in July. In manufacturing, the average workweek edged down by 0.2 hour to 39.9 hours, and overtime edged down by 0.1 hour to 2.8 hours. The average workweek for production and nonsupervisory employees edged down by 0.1 hour to 33.7 hours.
The number of job openings held steady at 8.2 million over June and both the number of hires and total separations were little changed at 5.3 million and 5.1 million, respectively. Within separations, quits (3.3 million) and layoffs and discharges (1.5 million) changed little. The number of job openings decreased in durable goods manufacturing (-88,000).
Consumer confidence rose in July, up 2.5 points from a downwardly revised level in June to 100.3. Elevated prices, especially for food and groceries, remained a top concern, followed by the U.S. political situation and the labor market. On a six-month moving average basis, purchasing plans for homes fell to a 12-year low. Purchasing plans for cars were stable but plans to buy appliances increased slightly and plans to buy a smartphone or laptop/PC were higher.
U.S. construction spending was 0.3% lower in June compared to May. Spending was up 6.2% Y/Y. Both public and private spending declined in June. Private residential was down as a drop in new single family offset a small gain in new multifamily. Manufacturing spending was roughly stable (up 0.1%) and was 19.1% higher than a year ago.
Following a decline in June likely related to a multi-day computer system disruption at dealerships across the country, light vehicle sales rose in July to a 15.8 million seasonally adjusted annual rate (SAAR). Despite the rebound, sales were lower than they were in both May and April.
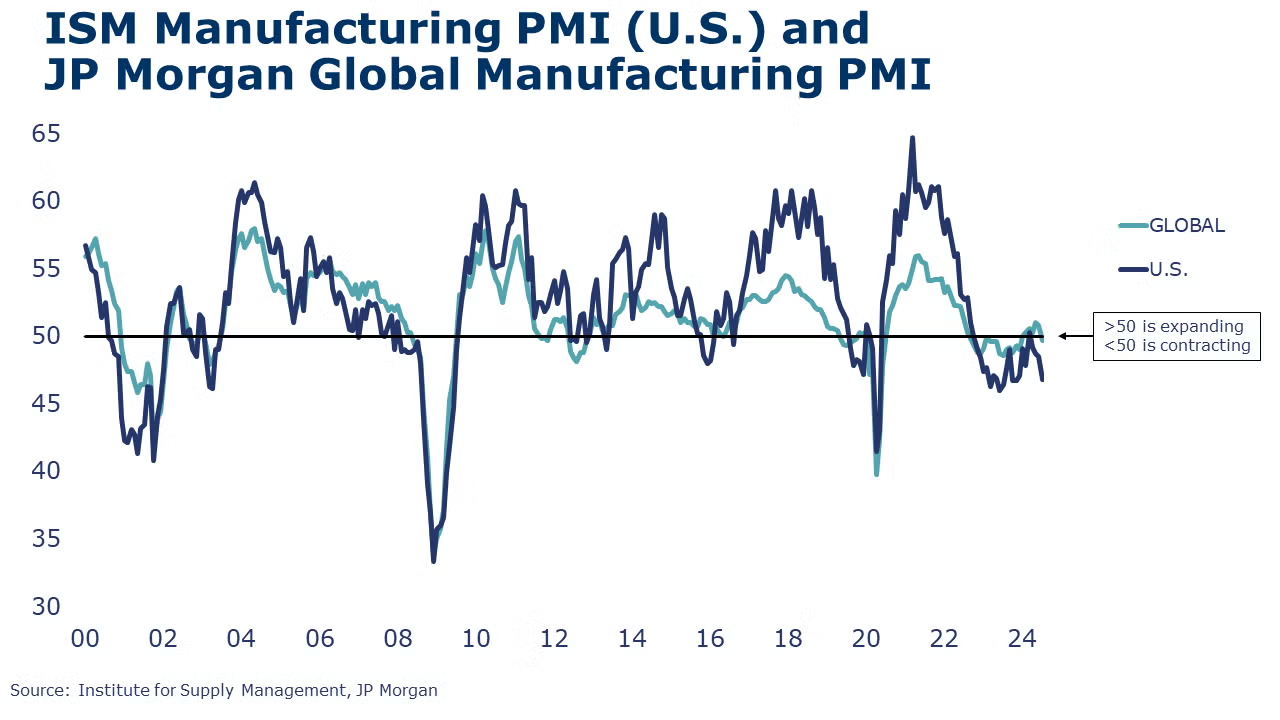
The ISM’s Manufacturing PMI for July signaled a fourth month of contraction in the U.S. industrial sector. The index declined 1.7 percentage points to 46.8% in July and has been under the 50% mark for 20 out of the past 21 months. In July, there were signs of slowing demand and declines in output as new orders, production activity and employment all declined. All six of the largest manufacturing sectors tracked – including Chemicals – contracted in July.
Looking abroad, the JP Morgan Global Manufacturing PMI retreated below the 50% threshold for the first time this year. Global manufacturing output was essentially stagnant while new orders and new export orders contracted. Of the 32 nations for which PMI data were available, fewer than half (15) registered an expansion in manufacturing production. Within segments, the steepest declines were in the investment goods sector, with smaller declines in consumer and intermediate goods.
Headline factory orders fell 3.3% in June, following a 0.5% decline in May. As discussed last week, much of the decline was led by lower orders for civilian aircraft. Orders for core business goods (nondefense capital goods excluding aircraft) rose 0.9%, rebounding from a similar decline in May. Orders were higher for construction materials, IT goods, and defense capital goods. Those gains were partially offset by lower orders for motor vehicles, computers, and consumer goods. Unfilled orders (a measure of the manufacturing pipeline) fell 1.4%, the first monthly decline in nearly four years. Manufacturers’ shipments rose 0.5% and inventories were essentially flat following modest gains in April and May. The inventories-to-shipments ratio edged slightly lower to 1.46. A year ago, the ratio was 1.49.
ENERGY
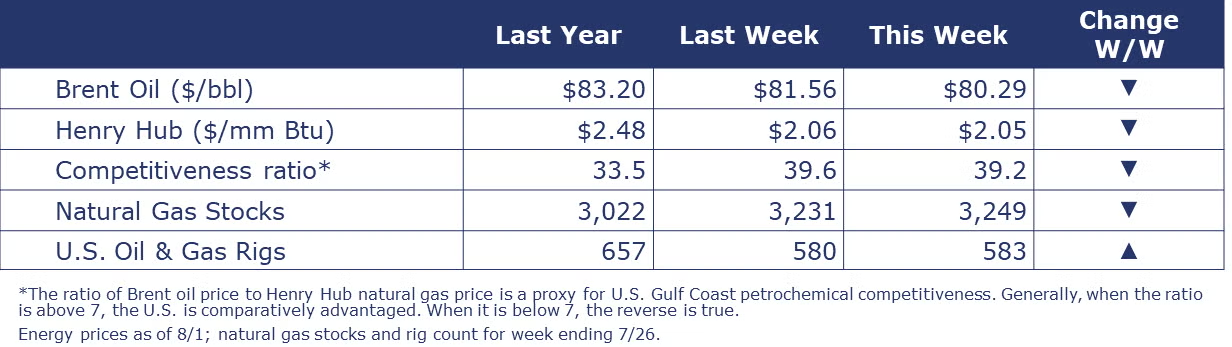
Despite rising tensions in the Middle East from this week’s assassination of Hamas’ leader in Iran, oil prices were lower from a week ago due to ongoing concerns about China’s economy. U.S. natural gas prices remained near $2 despite the full restart of the Freeport LNG export facility following damage from Hurricane Beryl. The combined oil and gas rig count rose by three to 583.
CHEMICALS
Indicators for the business of chemistry suggest a yellow banner.
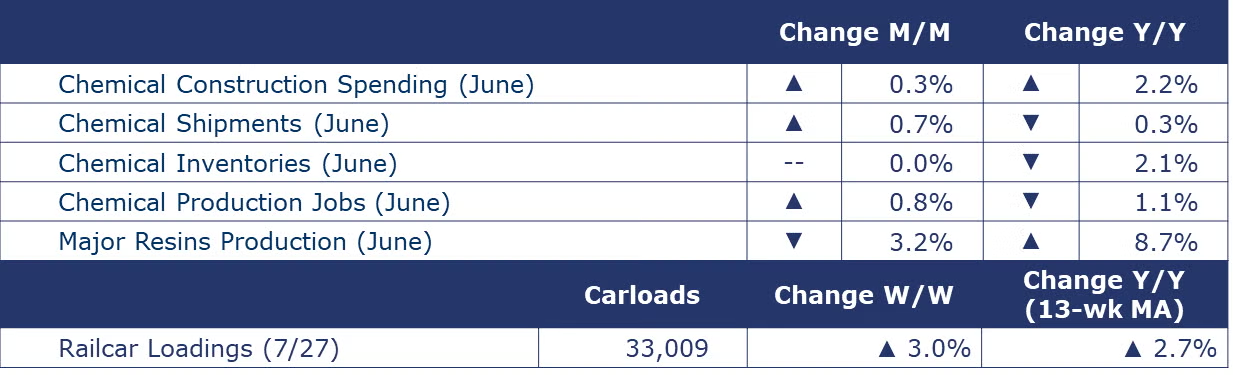
According to data released by the Association of American Railroads, chemical railcar loadings were up to 33,009 for the week ending July 27. Loadings were up 2.7% Y/Y (13-week MA), up (3.9%) YTD/YTD and have been on the rise for 8 of the last 13 weeks.
Chemicals employment was steady over June, rising 0.1% to 556,600 jobs including production work jobs which rose 0.8% to 365,700 jobs. Chemicals production jobs were down 1.1% Y/Y.
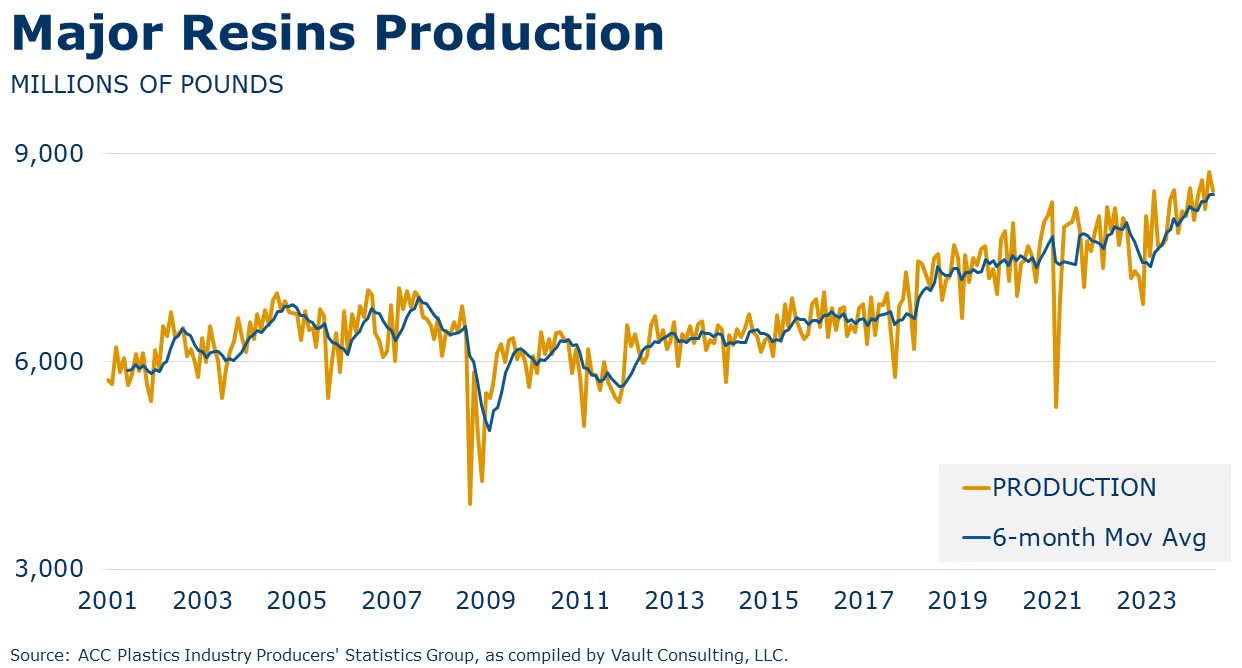
U.S. production of major plastic resins totaled 8.4 billion pounds during June 2024, a decrease of 3.2% compared to the prior month, and an increase of 8.7% compared to the same month in 2023, according to statistics released today by ACC. Year-to-date production was 50.4 billion pounds, a 6.5% increase as compared to the same period in 2023. Sales and captive (internal) use of major plastic resins totaled 8.6 billion pounds during June 2024, an increase of 0.4% compared to the prior month, and an increase of 7.3% from the same month one year earlier. Year-to-date sales and captive use were 50.5 billion pounds, an 8.7% increase as compared to the same period in 2023.
The ISM’s Manufacturing PMI report for July signaled another month of contraction in the chemical manufacturing sector. A respondent from the chemical sector commented, “business is relatively flat — the same volume, but smaller orders.” Chemical manufacturers reported growth in new orders but production was flat and employment declined in July. Lower inventories were reported but customers’ inventories were deemed “too high”. Prices paid for raw materials were higher.
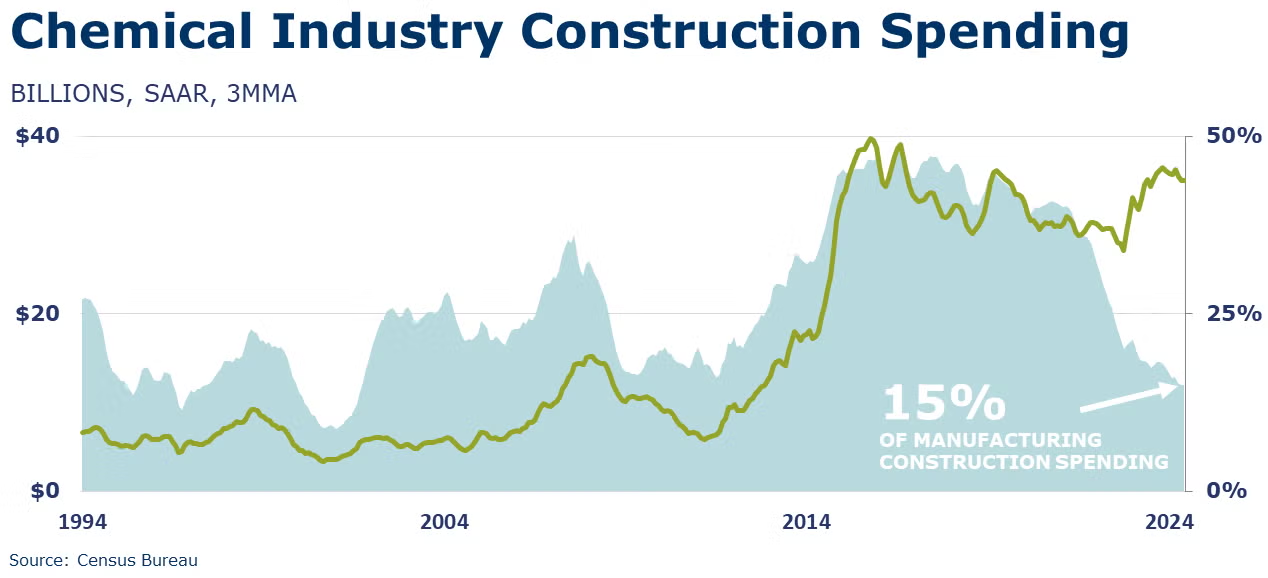
Construction spending in chemical manufacturing rose 0.3% in June to a level 2.2% higher Y/Y. Construction spending in chemical manufacturing continues to represent a significant portion, about 15%, of the value of total manufacturing construction put in place.
Chemical shipments rose 0.7% in June, the fifth consecutive monthly gain. Gains in shipments of agricultural and other chemicals offset declining shipments of coatings & adhesives. Chemical inventories were essentially flat as gains in inventories of coatings & adhesives and other chemicals offset lower inventories of agricultural chemicals. Compared to a year ago, unadjusted shipments remained lower by 0.3% and inventories were off 2.1% Y/Y. The inventories-to-sales ratio remained stable at 1.19, which was lower than last June’s ratio of 1.24.
Note On the Color Codes
Banner colors reflect an assessment of the current conditions in the overall economy and the business chemistry of chemistry. For the overall economy we keep a running tab of 20 indicators. The banner color for the macroeconomic section is determined as follows:
Green – 13 or more positives
Yellow – between 8 and 12 positives
Red – 7 or fewer positives
There are fewer indicators available for the chemical industry. Our assessment on banner color largely relies upon how chemical industry production has changed over the most recent three months.
For More Information
ACC members can access additional data, economic analyses, presentations, outlooks, and weekly economic updates through ACCexchange.
In addition to this weekly report, ACC offers numerous other economic data that cover worldwide production, trade, shipments, inventories, price indices, energy, employment, investment, R&D, EH&S, financial performance measures, macroeconomic data, plus much more. To order, visit http://store.americanchemistry.com/.
Every effort has been made in the preparation of this weekly report to provide the best available information and analysis. However, neither the American Chemistry Council, nor any of its employees, agents or other assigns makes any warranty, expressed or implied, or assumes any liability or responsibility for any use, or the results of such use, of any information or data disclosed in this material.
Contact us at ACC_EconomicsDepartment@americanchemistry.com.

