MACROECONOMY & END-USE MARKETS
Running tab of macro indicators: 10 out of 20

The number of new jobless claims was unchanged (compared to the previous week’s upwardly revised level) at 264,000 during the week ending June 17. Continuing claims fell by 13,000 to 1.76 million, and the insured unemploymentrate for the week ending June 10 was unchanged at 1.2%.
According to data from the National Association of Realtors®, existing-home sales rose 0.2% in May to 4.3 million; this is down 20.4% Y/Y. Existing homes inventory was up M/M (3.8%), or the equivalent of 3 months' supply at the current monthly sales pace. Existing home prices fell 3.1% Y/Y.
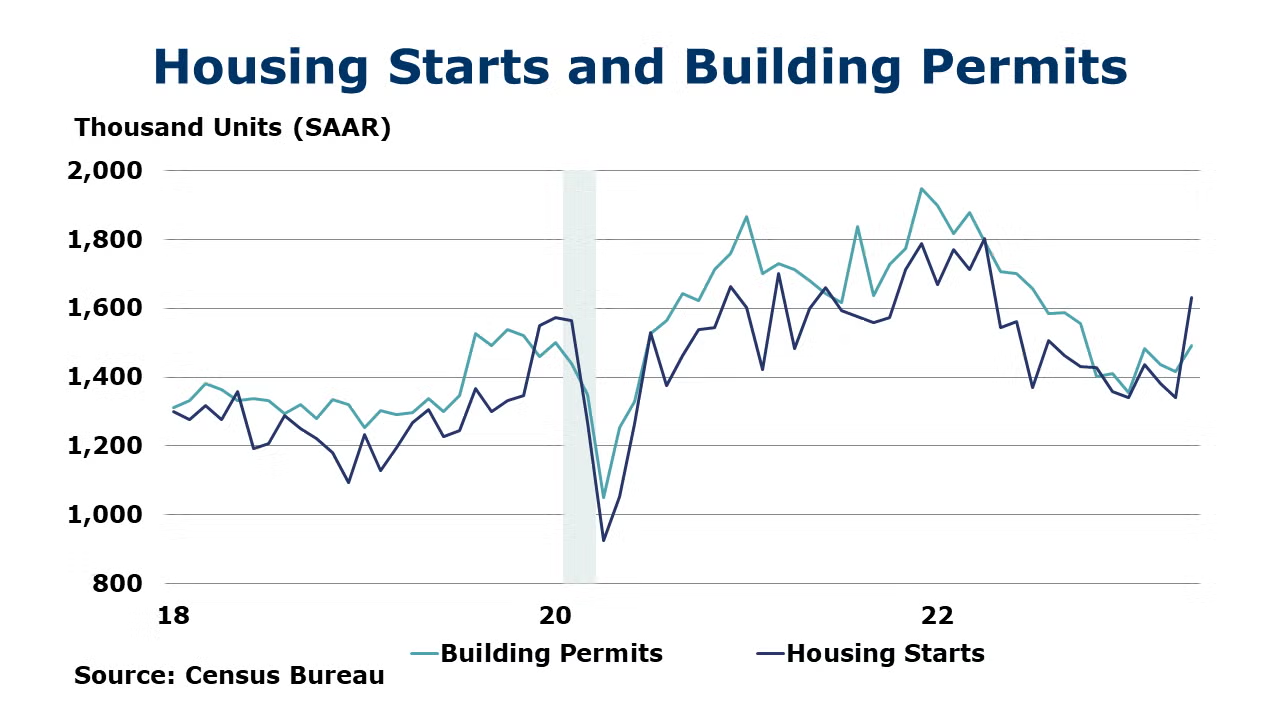
Seasonally adjusted housing starts rose in May by 21.7%. Chemistry-intensive single-family starts were up by 18.5% compared to the previous month. Following a decline in April, forward-looking building permits rose 5.2% in May, and single‐family authorizations were up by 4.8%. Multifamily permits were also higher in May. While permits remained lower than a year ago, housing starts were 5.7% above the May 2022 rate.
Following the improvement in May, NAHB/Wells Fargo homebuilder confidence moved into positive territory in June, registering 55. This is the highest reading since last July and the first time in 11 months that sentiment levels surpassed the midpoint of 50. All the subcomponents (current sales, sales expectations, and buyer traffic) recorded gains.
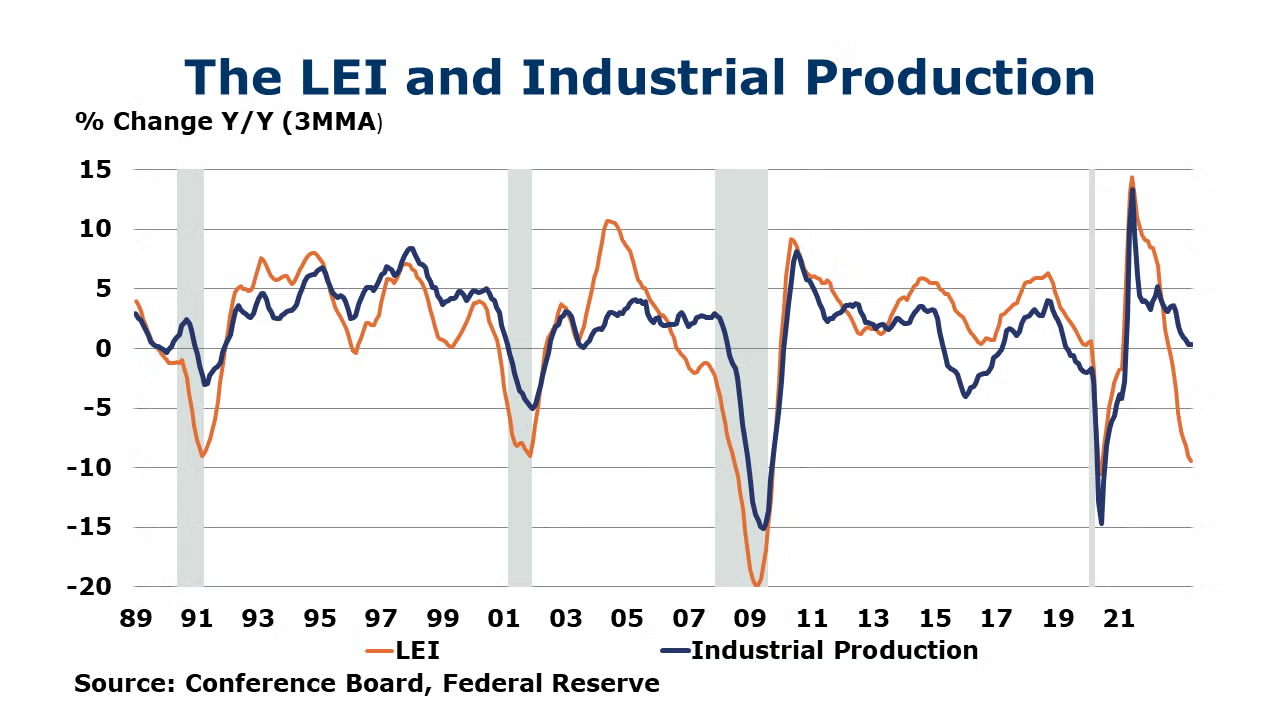
The Conference Board’s Leading Economic Index®, a reliable recession indicator, continued to decline for a 14th consecutive month in May, down by 0.7%. The decline reflects further deterioration in the gauges of consumer expectations, ISM new orders index, a negative yield spread and worsening credit conditions. The trend in the index continues to point to weaker economic activity ahead. The Conference Board expects the U.S. economy will contract over the Q3 2023 to Q1 2024 time frame. Compared to a year ago, the LEI was down 9.6% Y/Y.
The Kansas City Fed's monthly Survey of Tenth District (which includes Colorado, Oklahoma, Nebraska, Kansas, and Wyoming). Manufacturers showed that regional factory activity declined further in June. Firms’ expectations for future activity fell to their lowest levels since April 2020, although firms were still fairly optimistic about employment levels. The Chicago Fed Survey of Economic Conditions (CFSEC) showed further deterioration in June suggesting economic growth was well below trend in the Seventh Federal Reserve District that includes Illinois, Indiana, Michigan, Wisconsin, and Iowa.
ACC Survey of Economic Forecasters
Each month, ACC’s Economics & Data Analytics Department collects forecasts from a number of economic professionals who have a track record for accuracy and expert knowledge of manufacturing. The following are some of the most recent results. The Survey of Economic Forecasters is available to members on ACCExchange, ACC’s members-only platform.
U.S.
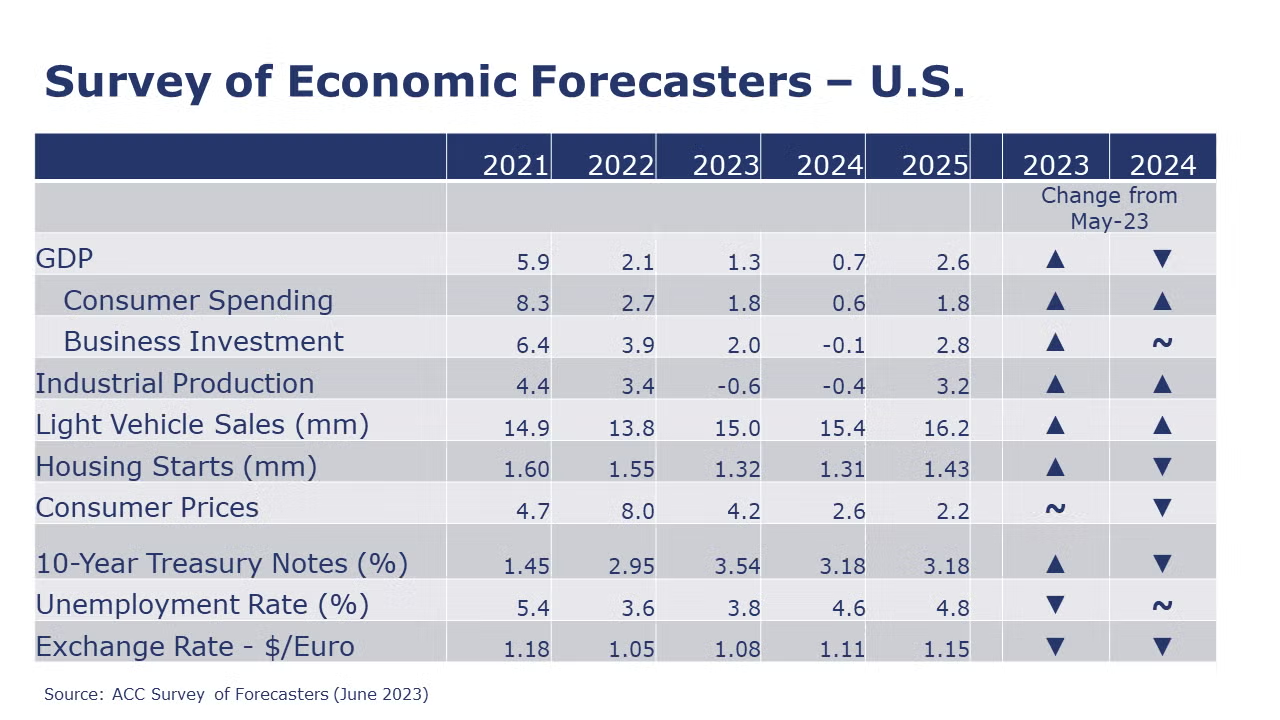
- Moving toward the end of the first half of the year, many indicators have weakened and suggest a downturn in the U.S. economy in the near-term. We continue to expect a short, mild recession to emerge in the second half of the year.
- Growth is expected to deteriorate in the next several quarters for consumer spending, business investment, and industrial production. With the expected downturn pushed further into the future, expectations for 2024 have deteriorated.
- U.S. GDP is expected to grow by a modest 1.3% in 2023 and to weaken (+0.7%) in 2024.
- Consumer spending growth is expected to slow to a 1.8% Y/Y pace in 2023 and slow further to a 0.6% gain in 2024.
- Dampened by higher borrowing costs and uncertainty, growth in business investment is also expected to decelerate to a 2.0% pace in 2023 before slipping by 0.1% in 2024.
- The deterioration in industrial production, that began in late-2022 is expected to continue through the start of 2024. Industrial production is expected to contract by 0.6% in 2023 and decline a further 0.4% in 2024.
- Vehicle production is a relatively bright spot in an otherwise lackluster outlook. With supply chain issues largely resolved, dealer inventories and assemblies have expanded, though higher borrowing costs and uncertainty will be headwinds. As a result, sales of autos and light trucks are expected to grow to 15.0 million in 2023 (still below trend) and 15.4 million in 2024.
- While it has struggled with high prices and mortgage rates, homebuilding may be finding a bottom, supported by extremely low inventories of existing homes. Housing starts are expected to come in at 1.32 million in 2023, before edging lower to 1.31 million in 2024.
- The unemployment rate is expected to move higher from 50-year lows to average 3.8% in 2023 and 4.6% in 2024.
- Higher interest rates are starting to curb inflation. Growth in consumer prices is expected to decelerate to a 4.2% pace in 2023 and 2.6% in 2024 (down from 8.0% in 2022).
- Expectations for interest rates (10-year Treasury) were slightly higher than last month for 2023, but lower for 2024.
Survey of Economic Forecasters – Global
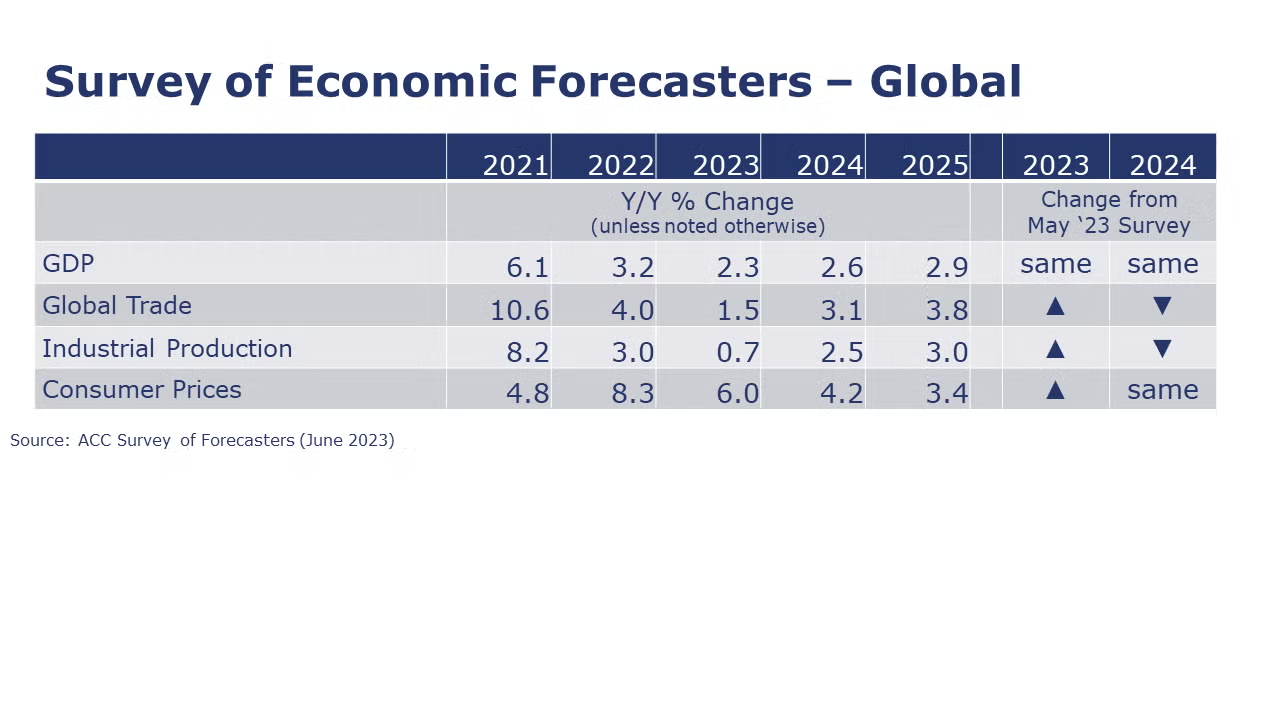
- Expectations for global economic growth this year remains at 2.3%. Expectations for next year are also unchanged and call for growth to pick to a 2.6% pace. China’s post-zero-Covid recovery has been soft and Europe continues to struggle with disruptions from Russia’s invasion of Ukraine. Economic expansion in emerging Asia/Pacific (especially India) will offset weaker GDP growth in Europe, Japan and North and South America.
- With weaker economic growth this year and a continued shift away from spending on goods, global industrial production growth will slow to 0.7% and trade volumes growth will ease to a 1.5% pace in 2023. In 2024, we expect production and trade volumes to grow by 2.5% and 3.1%, respectively.
- Global inflation forecasts were revised upwards to 6.0% this year. Inflation is expected to moderate to 4.2% in 2024 and further to 3.4% in 2025.
ENERGY
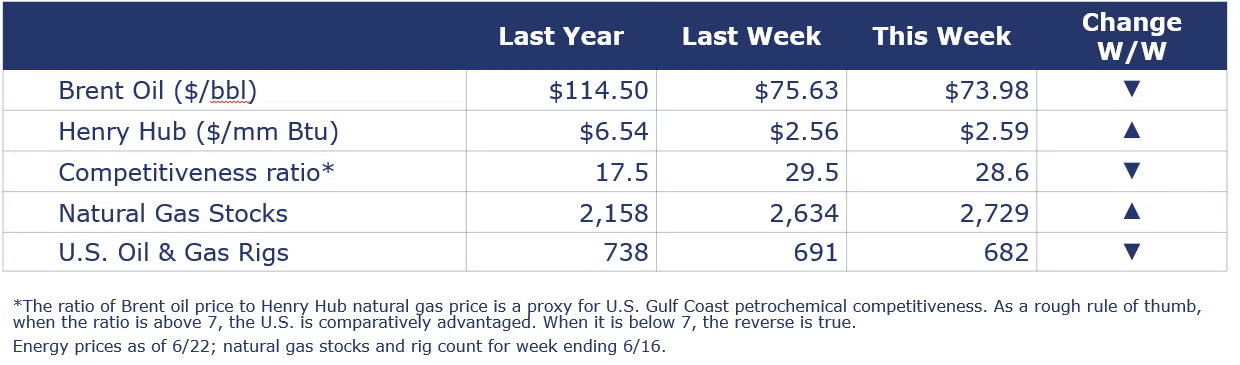
Oil prices eased compared to a week ago on renewed concerns about global demand and Fed Chairman Powell’s comments to Congress that further rate hikes might be necessary to bring inflation down. U.S. natural gas prices were slightly higher than a week ago, reflecting scorching temperatures in the U.S. Southwest. Down for a seventh consecutive week, the combined oil & gas rig count fell by nine to 682.
CHEMICALS
Indicators for the business of chemistry bring to mind a [red] banner.
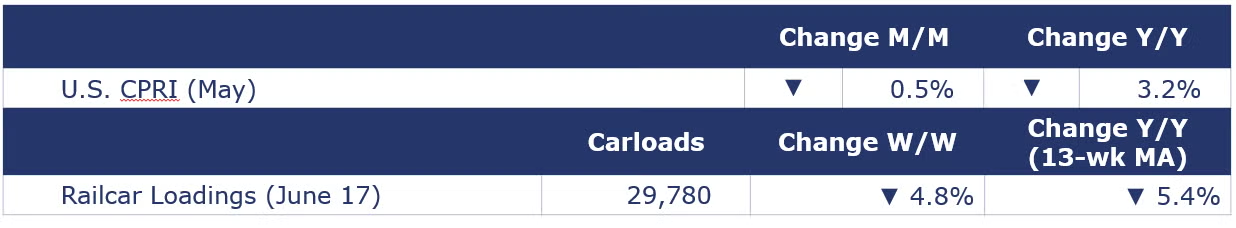
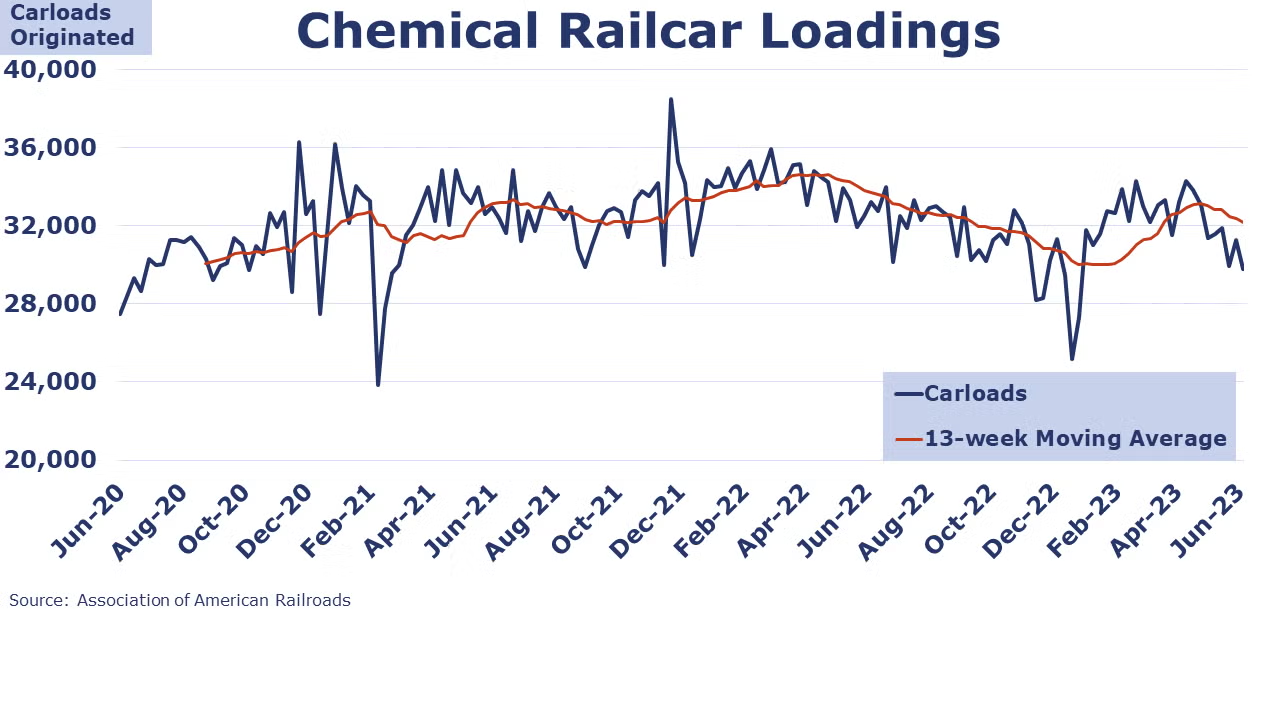
According to data released by the Association of American Railroads, chemical railcar loadings were down 1,487 to 29,780 for the week ending June 17. Loadings were down 5.4% Y/Y (13-week MA), down 4.7% YTD/YTD and have been on the rise for 7 of the last 13 weeks.
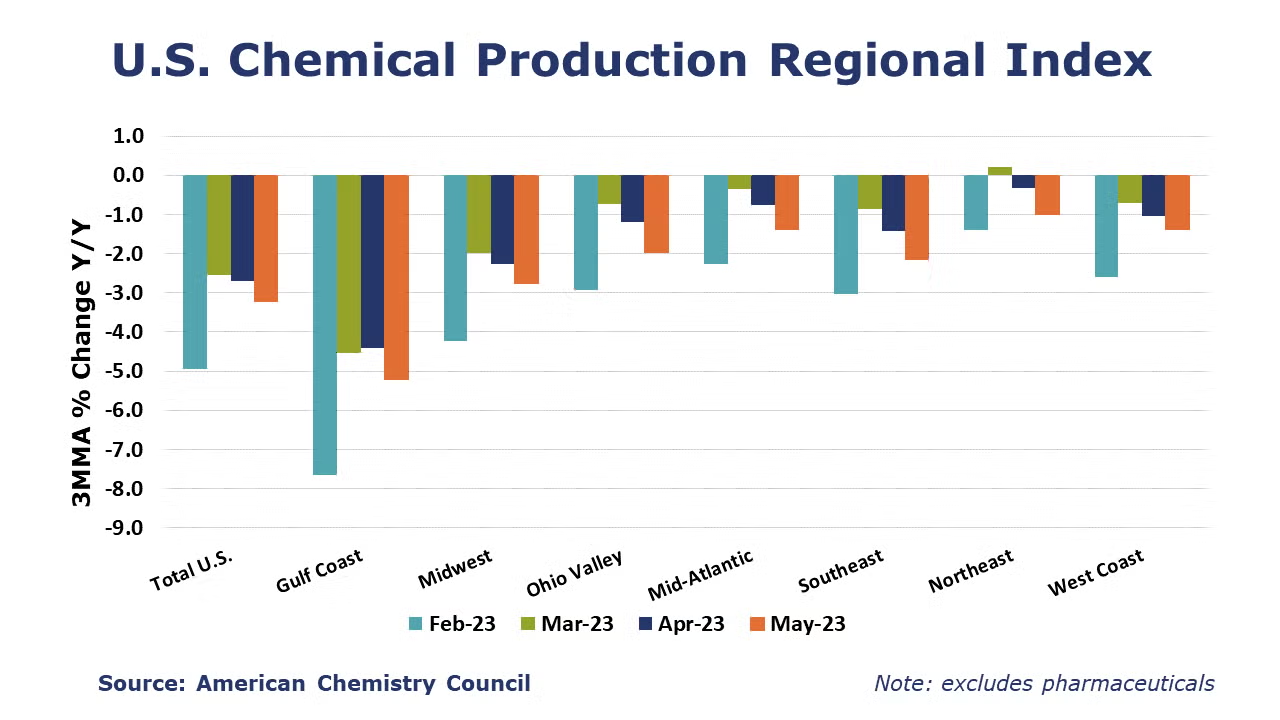
The U.S. Chemical Production Regional Index (U.S. CPRI) fell by 0.5% in May. Chemical output declined in all regions of the U.S. except for the West Coast where output ticked slightly higher. The largest declines were in the Gulf Coast region, home to much of the nation’s basic industrial chemical and synthetic material capacity. Compared to a year ago, chemical output was lower by 3.2% Y/Y with declines in all regions.
Note On the Color Codes
The banner colors represent observations about the current conditions in the overall economy and the business chemistry. For the overall economy we keep a running tab of 20 indicators. The banner color for the macroeconomic section is determined as follows:
Green – 13 or more positives
Yellow – between 8 and 12 positives
Red – 7 or fewer positives
For the chemical industry there are fewer indicators available. As a result, we rely upon judgment whether production in the industry (defined as chemicals excluding pharmaceuticals) has increased or decreased three consecutive months.
For More Information
ACC members can access additional data, economic analyses, presentations, outlooks, and weekly economic updates through ACCexchange.
In addition to this weekly report, ACC offers numerous other economic data that cover worldwide production, trade, shipments, inventories, price indices, energy, employment, investment, R&D, EH&S, financial performance measures, macroeconomic data, plus much more. To order, visit http://store.americanchemistry.com/.
Every effort has been made in the preparation of this weekly report to provide the best available information and analysis. However, neither the American Chemistry Council, nor any of its employees, agents or other assigns makes any warranty, expressed or implied, or assumes any liability or responsibility for any use, or the results of such use, of any information or data disclosed in this material.
Contact us at ACC_EconomicsDepartment@americanchemistry.com.

