MACROECONOMY & END-USE MARKETS
Running tab of macro indicators: 12 out of 20

Consumer prices fell by 0.1% in March, the first monthly decline in consumer prices since the beginning of the pandemic. The decline was led by a sharp fall in energy prices, in particular a 6.3% decline in gasoline prices. Lower gas prices offset higher prices for food. Prices for airline fares, motor vehicle insurance, used cars and trucks, and recreation were among the major indexes that decreased in March. Offsetting those declines were higher prices for personal care, medical care, education, apparel, and new vehicles. Compared to a year ago, consumer prices were up 2.4% Y/Y while core consumer prices (excluding food & energy) were up 2.8% Y/Y. Both comparisons eased for a second consecutive month.
Producer prices fell 0.4% in March (up 2.7% Y/Y). As with consumer prices, lower gasoline prices led the decline, accounting for two-thirds of the decline in the index for final demand goods. There were also declines in food prices as chicken egg prices eased from February’s record high. Excluding food and energy, core goods prices rose 0.3%, the same as last month. On a year-over-year basis, core prices for final demand goods was up 3.4%, an improvement compared to February. Services prices eased across a number of categories, including trade margins and transportation & warehousing.
Wholesale inventories rose 0.3% in February with gains across most segments. The largest inventory gains were in computer equipment, petroleum products, paper, lumber, professional equipment, hardware and alcohol. Sales at the wholesale level rose by 2.4%, also with broad gains across most segments. The inventories-to-sales ratio eased from1.32 in January to 1.30 in February. A year ago, the ratio was 1.34. Compared to a year ago, sales were up 4.3% Y/Y while inventories were up 1.1% Y/Y.
Consumer debt eased at a 0.2% annual rate in February, a sign that consumers were pulling back amid growing uncertainty. Credit card debt was essentially unchanged (up 0.1%), but nonrevolving debt (e.g., car loans, student loans, etc.) fell at a 0.3% rate.
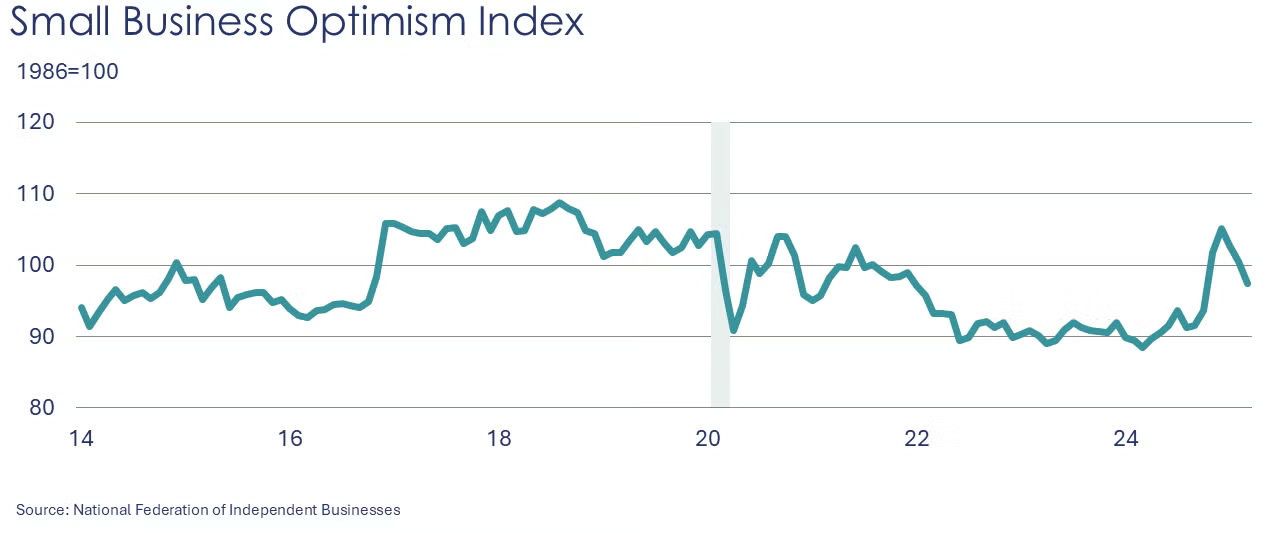
Small business optimism continued to slide in March, down 3.3 points to 97.4. NFIB noted it was the largest monthly decline since June 2022. Of the 10 subcomponents, only two increased. Sales expectations and a more pessimistic economic outlook were largest contributors to the decline.

Global semiconductor sales fell 2.9% in February, with declines across all regions. Sales in the Americas region, which have grown strongly over the past year, posted the largest decline, down 4.6% from January. Compared to a year ago, global semiconductor sales were down 17.1% Y/Y.
ENERGY
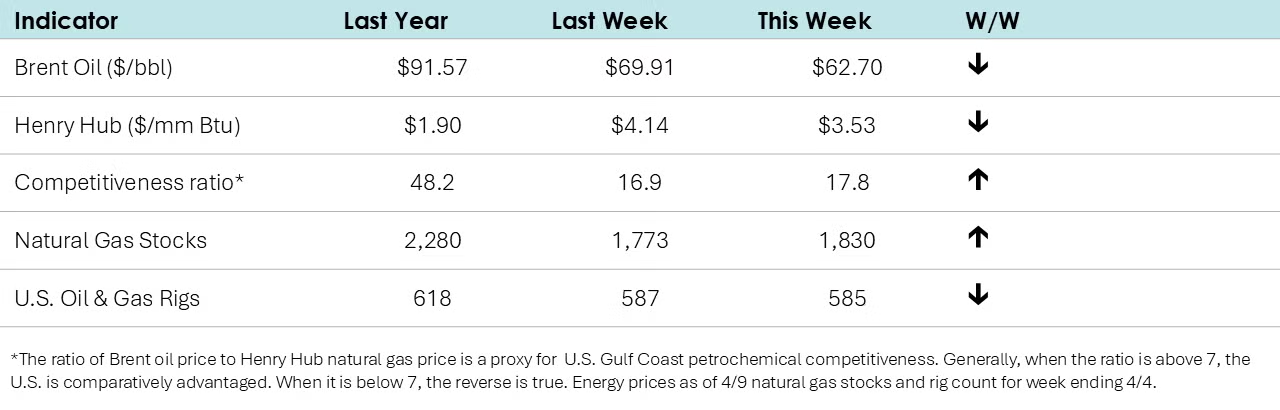
• Oil prices were lower than a week ago on greater economic uncertainty.
• U.S. natural gas prices were also lower than a week ago.
• The combined oil & gas rig count fell by two to 585.
CHEMICALS
Indicators for the business of chemistry suggest a yellow banner.
According to data released by the Association of American Railroads, chemical railcar loadings were down to 33,423 for the week ending April 5th. Loadings were up 2.2% Y/Y (13-week MA), up (2.2%) YTD/YTD and have been on the rise for eight of the last 13 weeks.
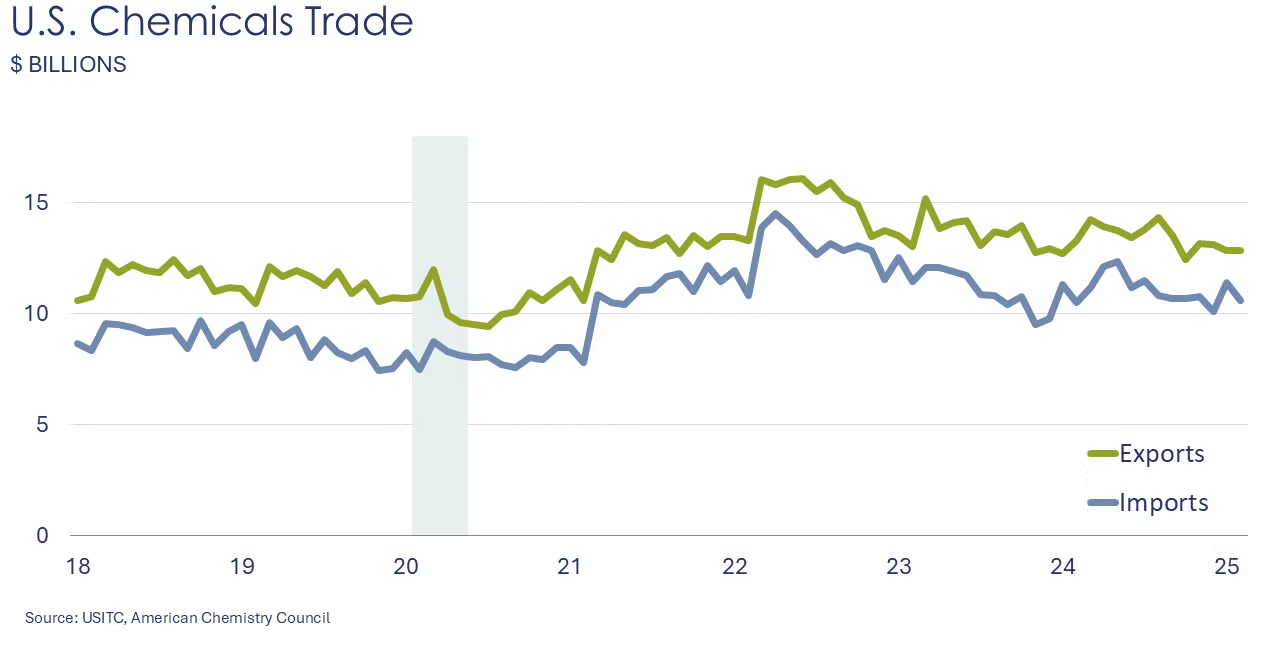
U.S. chemical exports fell for a third consecutive month, down by 3.0% in February, as tariff uncertainty emerged. The decline was concentrated in lower exports for basic chemicals, especially bulk petrochemicals & intermediates, petrochemical derivatives and other basic chemicals. Those declines were partially offset by higher exports of specialty chemicals, agricultural chemicals, and consumer products. Chemical imports fell sharply, down by 7.2% in February, with large declines in imports of bulk petrochemicals & intermediates, petrochemical derivatives and other basic chemicals. Imports of consumer products also declined. Imports of specialty chemicals and agricultural chemicals were higher. Compared to a year ago, chemical exports were down 6.5% Y/Y while imports were ahead by 0.9% Y/Y. As imports fell faster than exports, the trade surplus in chemicals rose from $1.4 billion in January to $1. 9 billion in February.
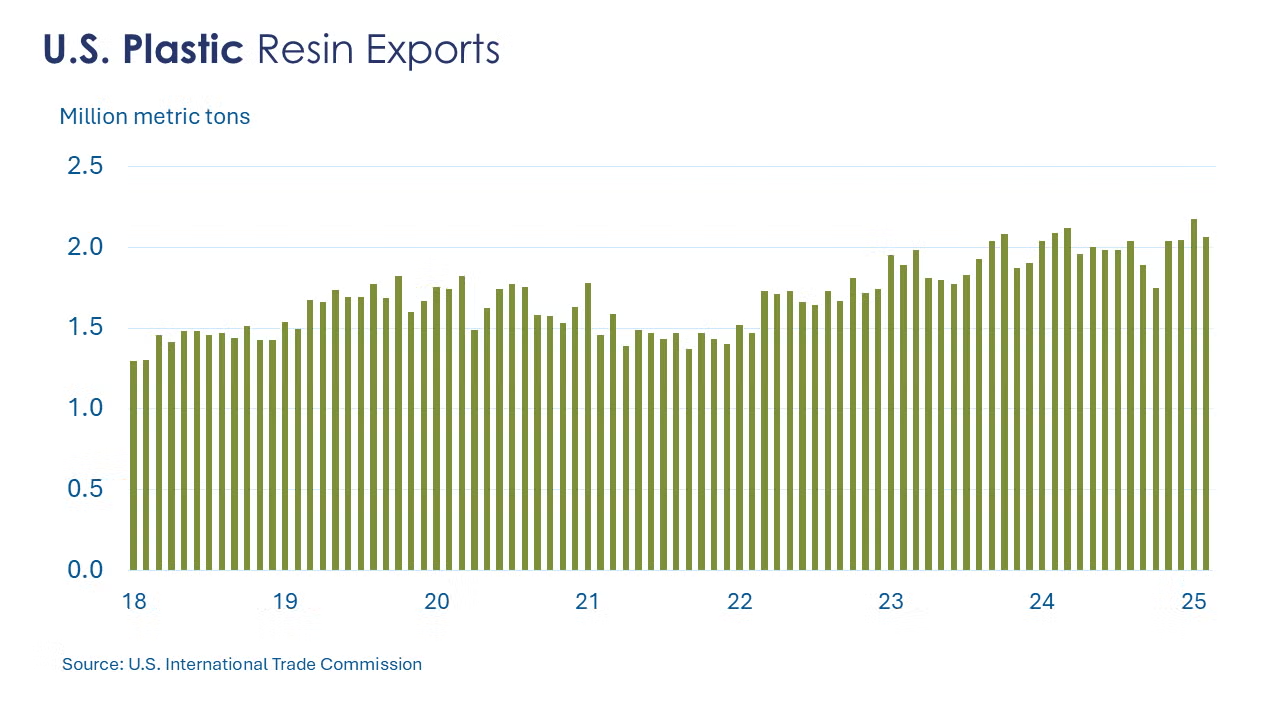
U.S. plastic resin exports fell 5.1% in February to 2.06 million metric tons. Resin exports were off 1.4% Y/Y.
Chemical producer prices rose for a third consecutive month in March, up by 0.8%. The largest price gains were in plastic resins. There were also higher prices for inorganic chemicals, bulk petrochemicals & organics, agricultural chemicals, and synthetic rubber. These price increases were partially offset by lower prices for coatings, other specialty chemicals, consumer products and manufactured fibers. Compared to a year ago, chemical prices were ahead 3.1% Y/Y.
Wholesale chemical inventories rose 0.7% in February, following a 0.4% decline in January. Sales of chemicals at the wholesale level rose 2.8% (after a 3.8% drop in January). The inventories-to-sales ratio fell from 1.15 in January to 1.13 in February. That was just slightly higher than the ratio last February. Compared to last February, sales were off 0.3% Y/Y while inventories were up 0.6% Y/Y.
Note On the Color Codes
Banner colors reflect an assessment of the current conditions in the overall economy and the business chemistry of chemistry. For the overall economy we keep a running tab of 20 indicators. The banner color for the macroeconomic section is determined as follows:
Green – 13 or more positives
Yellow – between 8 and 12 positives
Red – 7 or fewer positives
There are fewer indicators available for the chemical industry. Our assessment on banner color largely relies upon how chemical industry production has changed over the most recent three months.
For More Information
ACC members can access additional data, economic analyses, presentations, outlooks, and weekly economic updates through ACCexchange.
In addition to this weekly report, ACC offers numerous other economic data that cover worldwide production, trade, shipments, inventories, price indices, energy, employment, investment, R&D, EH&S, financial performance measures, macroeconomic data, plus much more. To order, visit the ACC Store.
Every effort has been made in the preparation of this weekly report to provide the best available information and analysis. However, neither the American Chemistry Council, nor any of its employees, agents or other assigns makes any warranty, expressed or implied, or assumes any liability or responsibility for any use, or the results of such use, of any information or data disclosed in this material.
Questions? Contact ACC's Economics & Data Analytics team via email.

