MACROECONOMY & END-USE MARKETS
Running tab of macro indicators: 9 out of 20
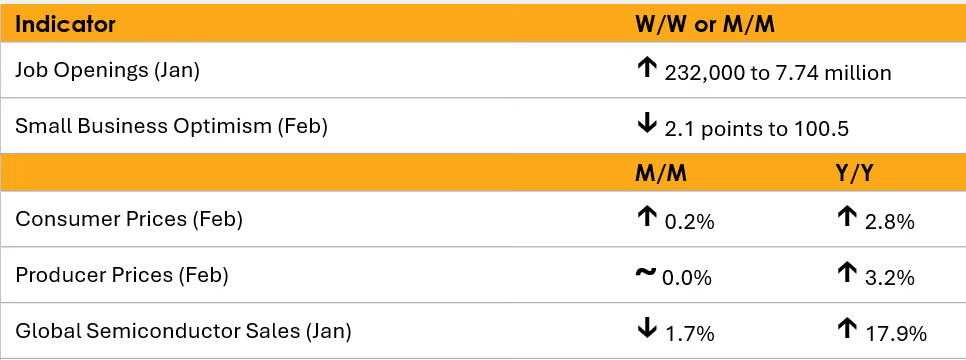
Job openings were slightly higher in January, up by 232,000 to 7.74 million. The number of workers that voluntarily quit their job also rose to the highest level since July. It’s important to note, however, the report does not reflect the hiring freeze for Federal workers that went into effect on January 20th or the subsequent layoffs.
Consumer prices rose by a more moderate 0.2% in February. Compared to a year ago, consumer prices were up 2.8% Y/Y. Core consumer prices also rose 0.2% and were up 3.1% Y/Y, the lowest annual gain in nearly four years.
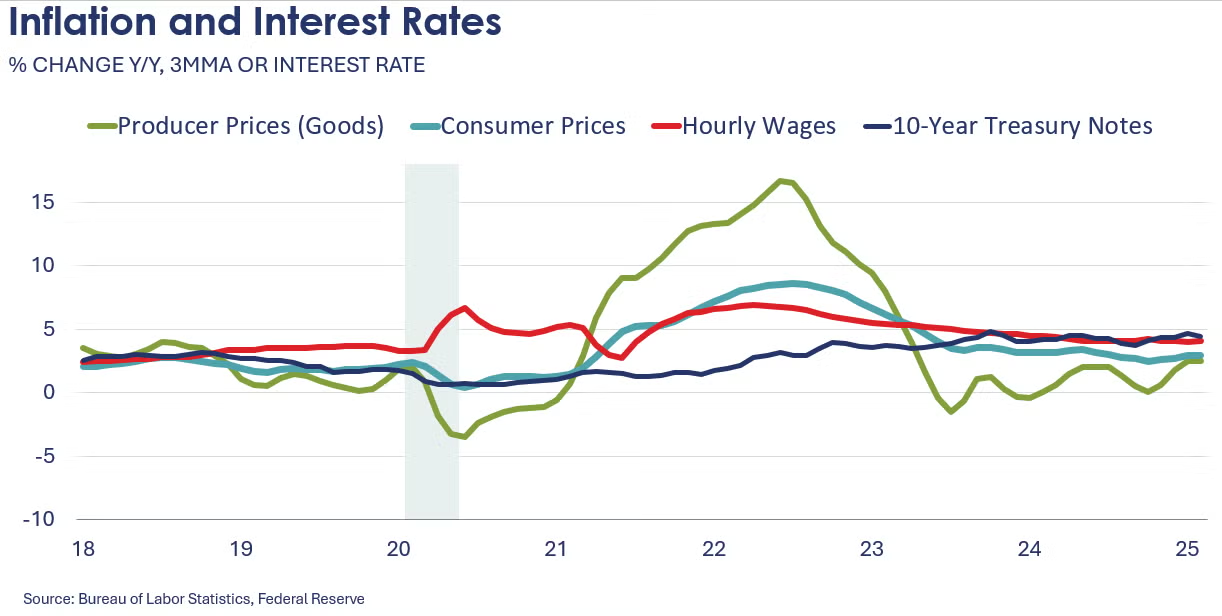
Growth in producer prices also moderated in February. The headline producer price index was flat in February, following a 0.6% gain in January. The decline was led by lower prices for energy and trade margins. Offsetting those declines, however, were higher prices for foods (notably eggs due to the bird flu outbreak) and other goods (electricity, carbon steel, and tobacco products). The price index for core goods posted its highest monthly gain in two years. Compared to a year ago, headline producer prices were up 3.2% Y/Y while core prices were up 3.3% Y/Y, both improvements over the previous month.
Small business optimism fell in February, down 2.1 points to 100.7. Of the 10 sub-components, three increased and seven decreased. The Uncertainty Index rose 4 points to 104, the second highest reading on record. In addition, small businesses' hiring plans have been pared back.
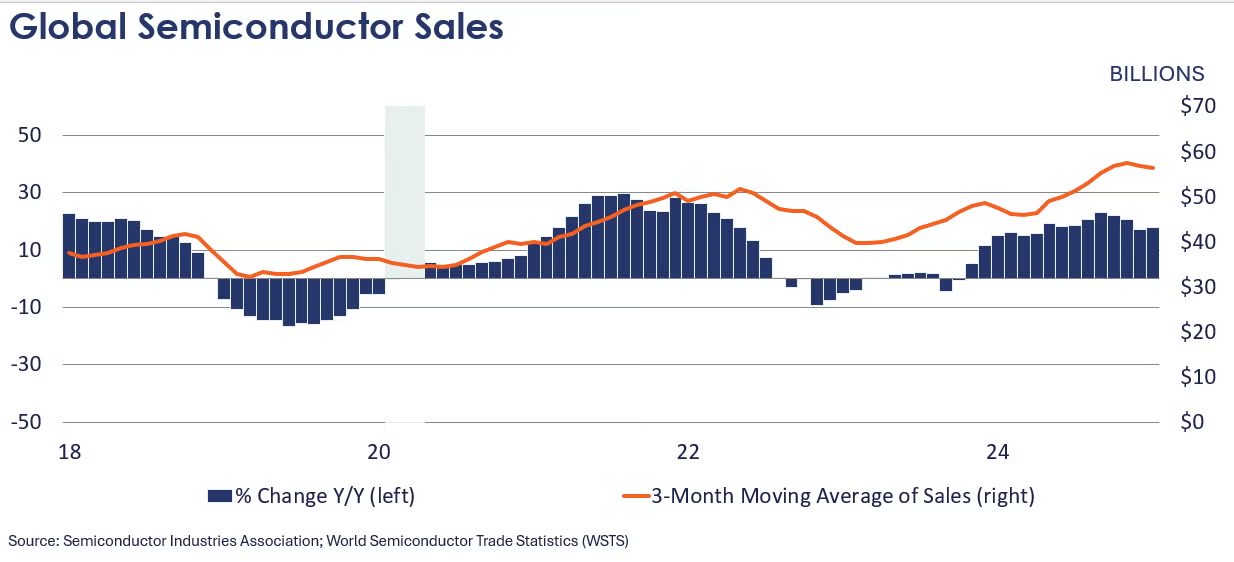
Global semiconductor sales eased by 1.7% in January to $56.52 billion with declines in all regions except Asia Pacific/All Other. Compared to a year ago, sales were up 17.9% with the largest growth in the Americas which was up 50.7% Y/Y.
ENERGY
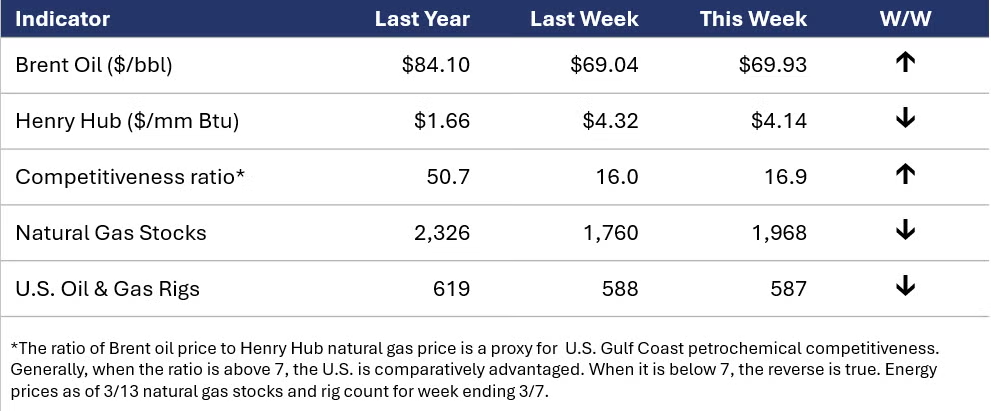
- Oil prices were slightly higher than a week ago as U.S. commercial supplies tightened, and the U.S. imposed fresh sanctions on Iran’s oil operations.
- U.S. natural gas prices eased from a week ago but remain above $4/mmbtu. Last week’s inventory draw was smaller than expected, but inventories remain nearly 12% below their historic average.
- The combined oil and gas rig counted fell by one to 587 at the end of last week.
CHEMICALS
Indicators for the business of chemistry suggest a yellow banner.
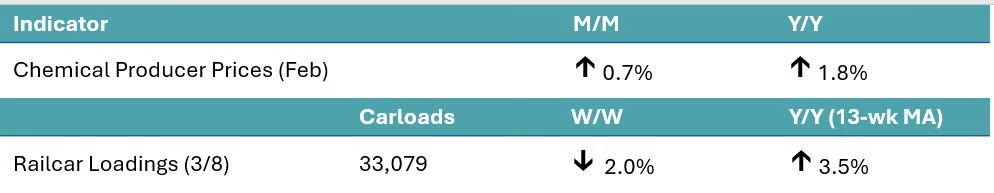
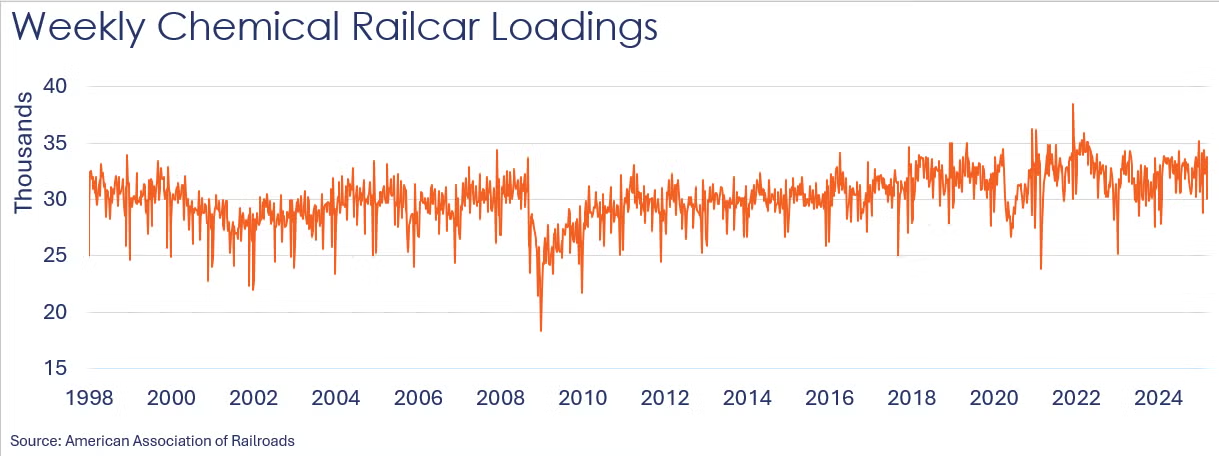
According to data released by the Association of American Railroads, chemical railcar loadings were down to 33,079 for the week ending March 8th. Loadings were up 3.5% Y/Y (13-week MA), up (2.1%) YTD/YTD and have been on the rise for seven of the last 13 weeks.
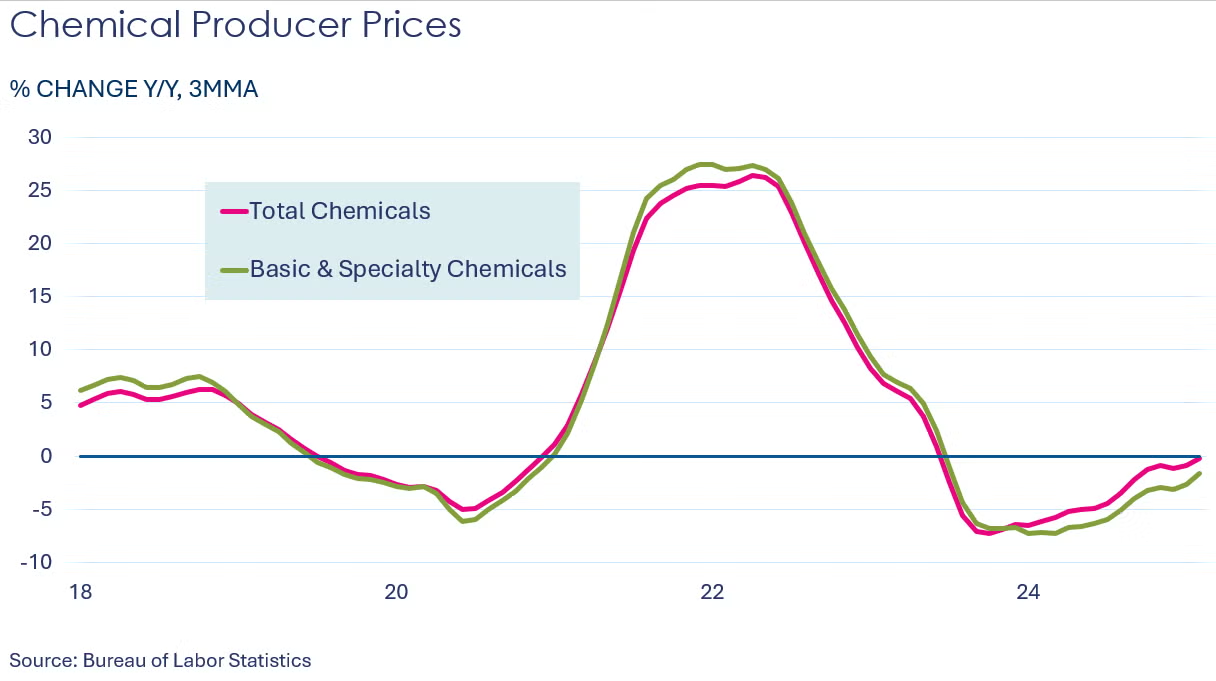
Chemical producer prices were higher (up by 0.7%) for a second month in February. Gains were nearly across the board for all segments with the exception of manufactured fibers. The largest gains were in prices for bulk petrochemicals & organics, plastic resins, and agricultural chemicals. Compared to last February, chemical prices were up 1.8% Y/Y, the largest Y/Y gain since March 2023.
Note On the Color Codes
Banner colors reflect an assessment of the current conditions in the overall economy and the business chemistry of chemistry. For the overall economy we keep a running tab of 20 indicators. The banner color for the macroeconomic section is determined as follows:
Green – 13 or more positives
Yellow – between 8 and 12 positives
Red – 7 or fewer positives
There are fewer indicators available for the chemical industry. Our assessment on banner color largely relies upon how chemical industry production has changed over the most recent three months.

