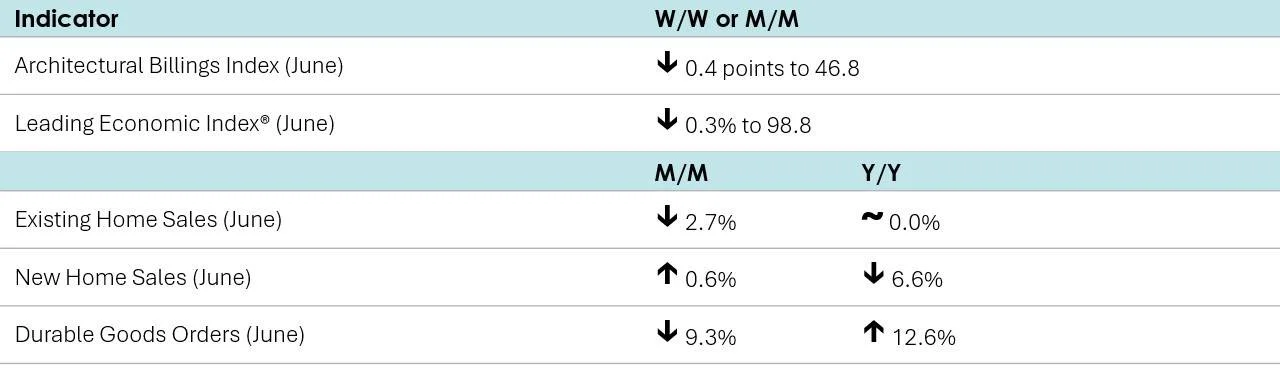
The Conference Board’s Leading Economic Index® fell 0.3% in June, following upwardly revised flat growth in May. The index (now at 98.8) was down 2.8% over the first half of the year, a substantially faster rate of decline compared to the 1.3% contraction over the second half of 2024. Lower consumer expectations and new orders were the largest contributors to the decline.
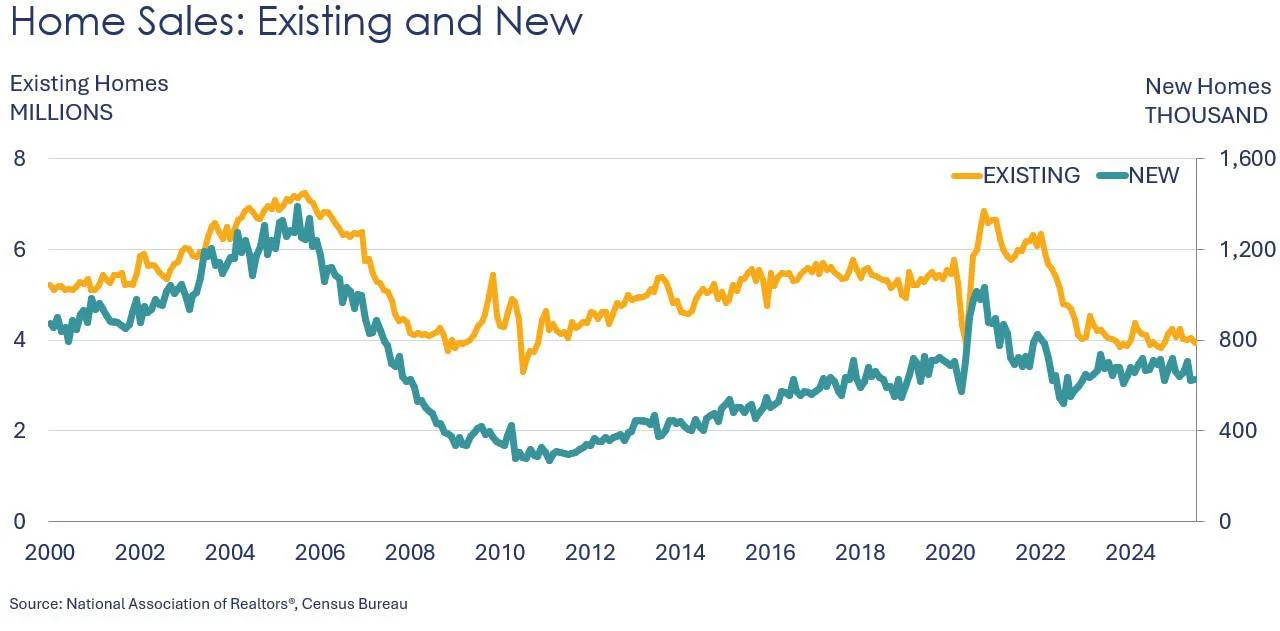
Existing home sales fell 2.7% in June to a 3.93 million seasonally adjusted annual rate (SAAR). Inventories declined 0.6% on the month but were up nearly 16% Y/Y, while sales were flat from a year ago. At the current sales pace, inventories represented a 4.7-month supply (the highest since 2016 excluding May 2020). The median sales price rose 2.0% Y/Y to $435,300.
Following a decline in May, new home sales rose in June, up 0.6%. May was the lowest rate since November 2024. With 33,000 pounds of chemistry in a typical single-family home, new residential construction is an important end-use market for chemicals. The inventory of unsold homes rose and represented a 9.8-month supply at the current sales pace. Compared to a year ago, inventories were up 8.5% Y/Y while sales were down 6.6% Y/Y. The median sales price was down 2.9% Y/Y.
The AIA/Deltek Architecture Billings Index (ABI) pointed to a continued contraction in June with a score of 46.8, down from 47.2 in May. A score below 50 represents a contraction in billings as more firms report a decrease (rather than an increase) in activity. Excluding October 2024, the ABI has been in negative territory since August 2023. Despite the decline in billings, the index measuring inquiries into new projects increased for the second straight month.
Headline durable goods orders tumbled 9.3% in June, following a 16.5% rebound in May. The decline was led (as is often the case) by a sharp pullback in civilian aircraft, a notoriously choppy segment. There were also declines in orders for computers and communications equipment. Those declines were partially offset by broad gains across several major categories, including defense aircraft, metals, machinery, other electronic products (i.e., semiconductors), motor vehicles, and electrical equipment. Core business orders (nondefense capital goods, excluding aircraft) eased by 0.7%, following a 2.0% gain in May. Compared to a year ago, core orders were up 5.0% Y/Y while headline orders were up 12.6% Y/Y.
Survey of Economic Forecasters
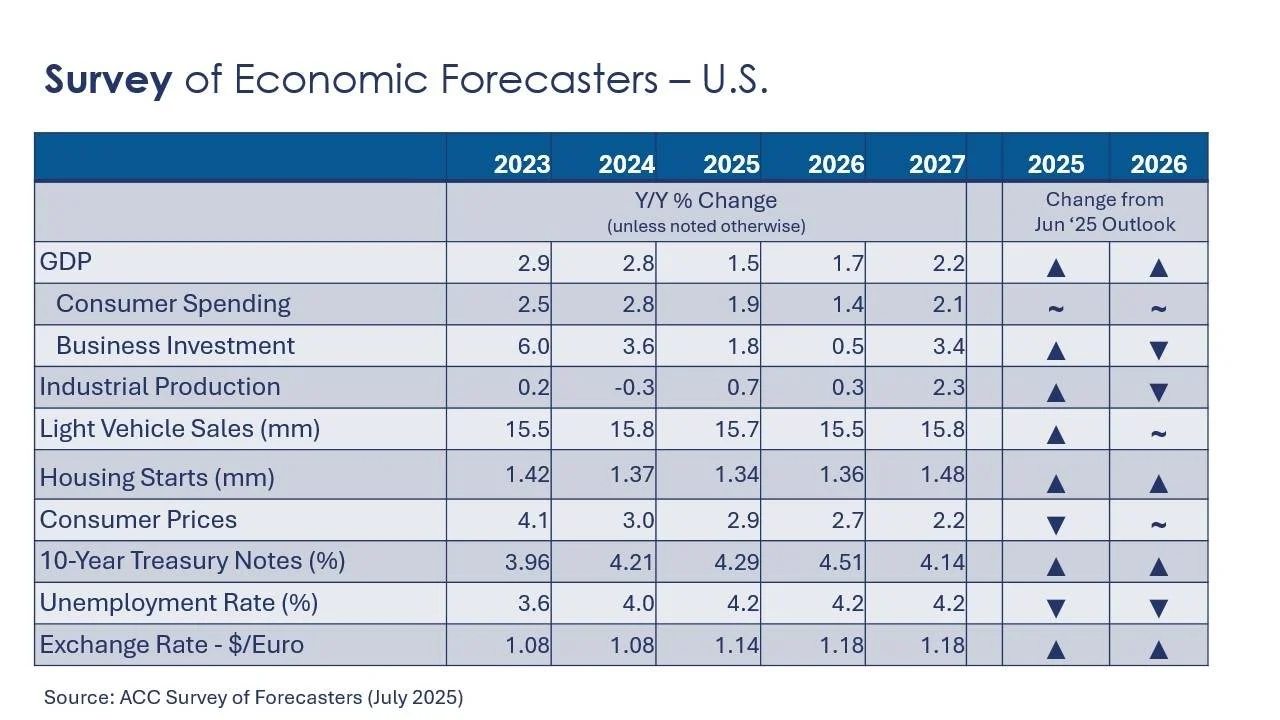
The U.S. economy continues to struggle with high levels of uncertainty. Recession odds remain higher than they were at the beginning of the year, but growth in the U.S. economy, while slowing, remains positive. Many of our forecast indicators improved in July.
- U.S. GDP is expected to grow by 1.5% in 2025 and by 1.7% in 2026, up a bit from our mid-year outlook.
- Growth in consumer spending is expected to moderate to a 1.9% pace in 2025 before easing further to a 1.4% gain in 2026.
- Business investment growth is expected to slow to 1.8% in 2025 before easing further to 0.5% in 2026.
- Following a 0.3% decline in 2024, we look for industrial production to grow only 0.7% in 2025 (led by a strong Q1) and 0.3% in 2026. Certain industries will be more impacted by tariffs than others.
- Sales of autos and light trucks rose to 15.8 million in 2024 (still below trend). Adding to affordability concerns, tariffs are expected to raise the cost of vehicles further. In 2025, vehicle sales are expected to decline slightly to 15.7 million pace (despite higher sales in March and April), before slipping further to a 15.5 million pace in 2026, as affordability constraints persist.
- Also struggling with affordability, housing starts fell to 1.37 million in 2024 and are expected to ease further to 1.34 million in 2025. Housing starts are expected to remain comparatively weak in 2026 at around 1.36 million.
- The unemployment rate is expected to increase slightly from 4.0% in 2024, averaging 4.2% through 2026.
- Growth in consumer prices is expected to ease slightly to 2.9% in 2025 (reflecting lower growth in services prices that are expected to offset higher prices for goods). In 2026, inflation continues to moderate with consumer prices growing 2.7%.
- Expectations for the 10-year Treasury were higher for 2025 and 2026.
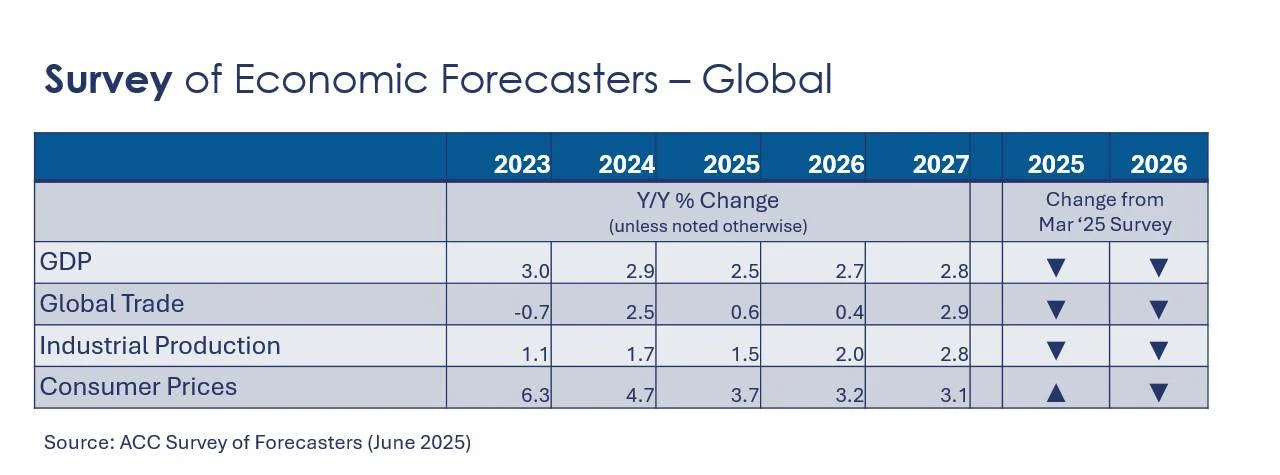
- Compared to the March outlook, global GDP growth expectations eased to 2.5% for 2025. The 2026 global growth forecast remained stable at 2.7%.
- Global inflation pressures have eased since 2022 but remain elevated. Inflation will continue to moderate, advancing at a 3.7% pace in 2025 and further easing to a 3.2% pace in 2026.
- Following more than two years of weakness in 2023 and 2024, global manufacturing continues to face headwinds in 2025, but is expected to firm slightly in the years ahead. Global industrial production is expected to grow 1.5% in 2025 and 2.0% in 2026, but both have been downwardly revised.
- Following a modest recovery in 2024, world trade volumes are expected to continue to expand over the next few years at a sharply slower pace. World trade volumes are expected to grow by only 0.6% in 2025 and 0.4% in 2026.
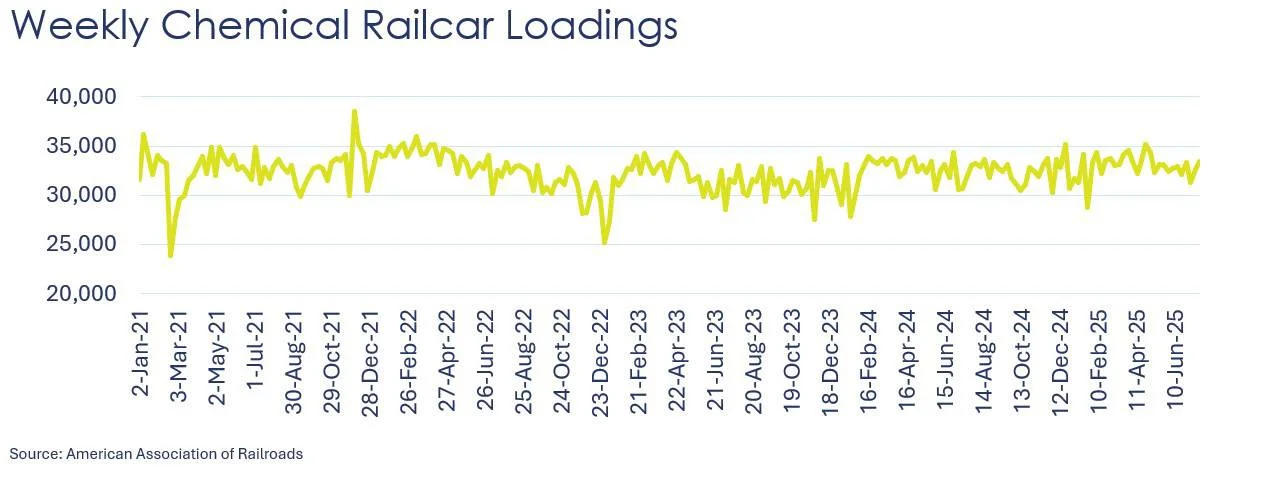
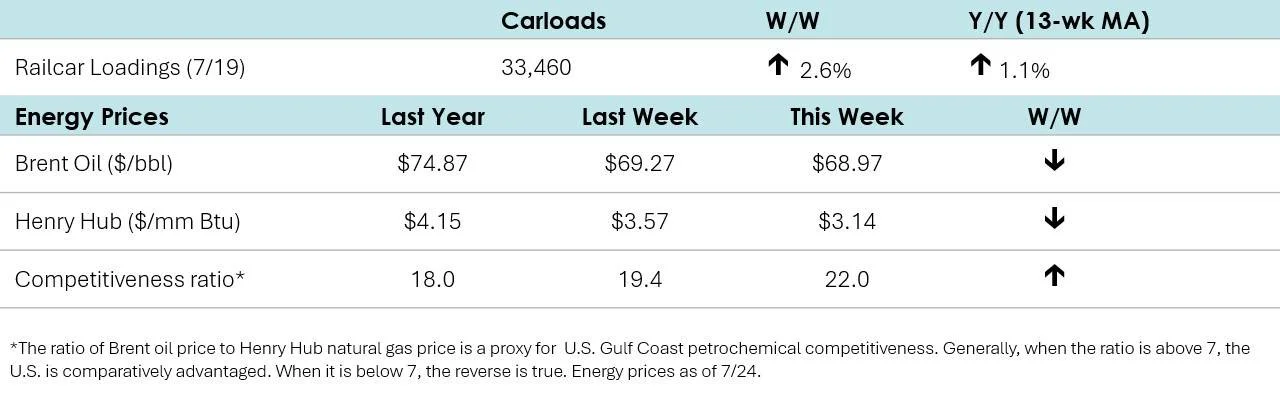
According to data released by the Association of American Railroads, chemical railcar loadings were up to 33,460 for the week ending July 19th. Loadings were up 1.1% Y/Y (13-week MA), up 1.9% YTD/YTD and have been on the rise for 7 of the last 13 weeks.
Energy Wrap-Up
- Oil prices moved lower on recent successful trade talks.
- U.S. natural gas futures were lower as the front-month contract rolled to August. Expectations for cooler weather next month contributed to the decline.
- The combined oil & gas rig count rose by 7 to 539, the first gain in nearly three months.
For More Information
ACC members can access additional data, economic analyses, presentations, outlooks, and weekly economic updates through ACCexchange.
In addition to this weekly report, ACC offers numerous other economic data that cover worldwide production, trade, shipments, inventories, price indices, energy, employment, investment, R&D, EH&S, financial performance measures, macroeconomic data, plus much more. To order, visit http://store.americanchemistry.com/.
Every effort has been made in the preparation of this weekly report to provide the best available information and analysis. However, neither the American Chemistry Council, nor any of its employees, agents or other assigns makes any warranty, expressed or implied, or assumes any liability or responsibility for any use, or the results of such use, of any information or data disclosed in this material.
Contact us at ACC_EconomicsDepartment@americanchemistry.com.

