Running tab of macro indicators: 12 out of 20

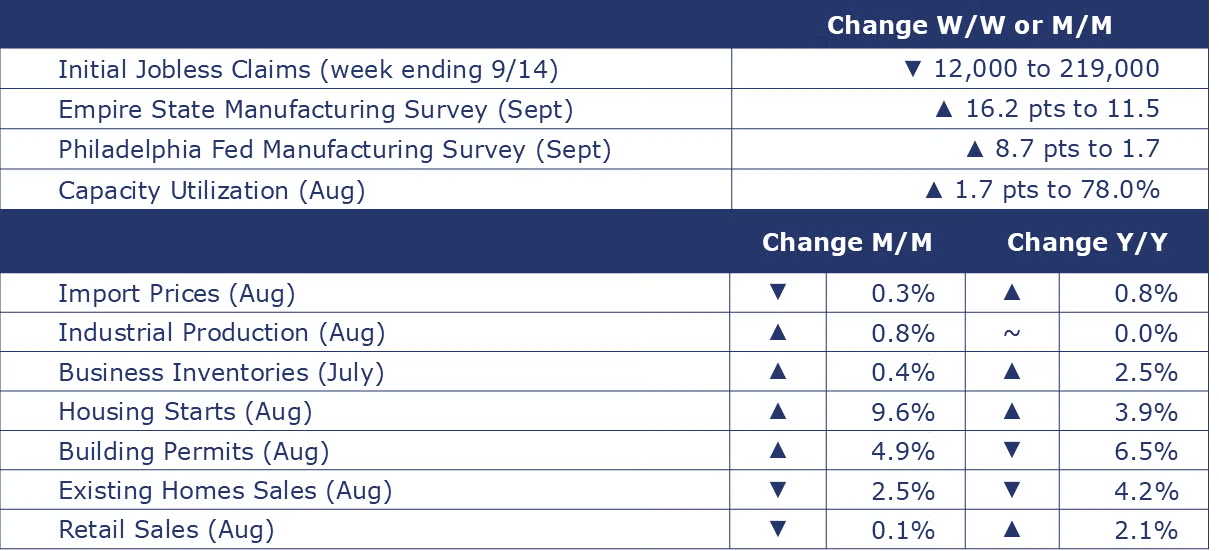
The number of new jobless claims fell by 12,000 to 219,000 during the week ending September 14. Continuing claims fell by 14,000 to 1.83 million, and the insured unemployment rate for the week ending September 7 was unchanged at 1.2%.
Retail sales were nearly flat (up 0.1%) in August, following an upwardly revised July. The largest monthly gains were in miscellaneous store retailers (up 1.7%) and non-store retailers (up 1.4%) while gasoline stations, electronics and appliance stores, and department stores saw the largest declines (1.2%, 1.1%, and 1.1%, respectively). Compared to August of last year, sales were up 2.1%.
U.S. import prices fell 0.3% in August as prices for both fuel and nonfuel imports declined. Over the past 12 months, import prices have risen by 0.8%. U.S. import prices last fell on a 12-month basis in February 2024. Export prices also declined in August and were down by 0.7% as both agricultural and non-ag exports prices fell. Over the past 12 months, export prices have declined by 0.7%.

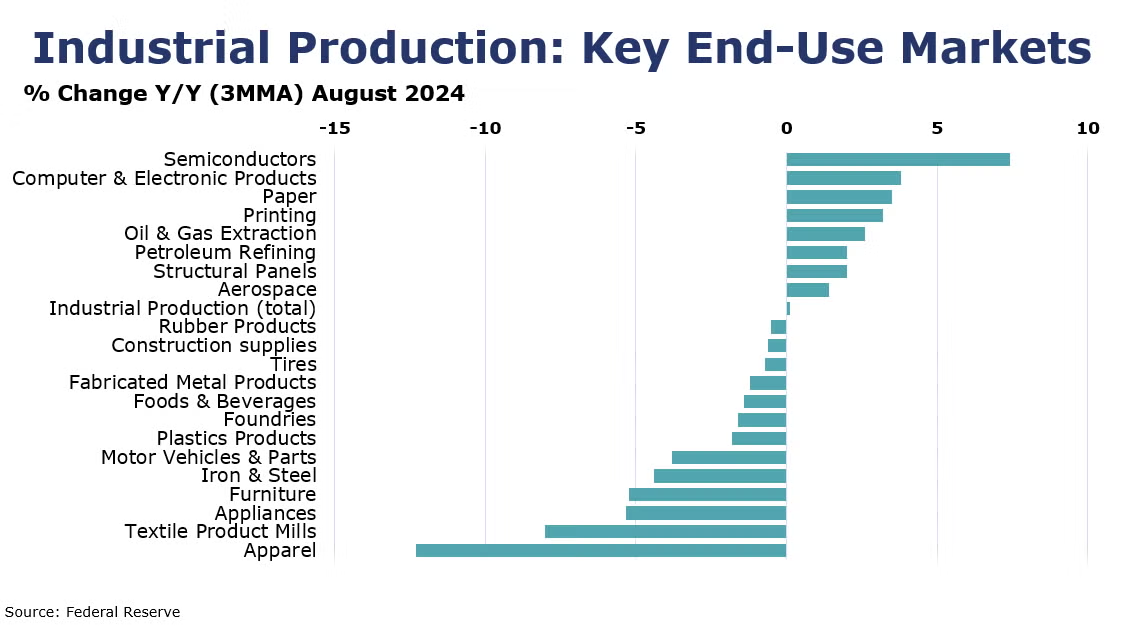
Headline industrial production rose 0.8% in August, following a 0.9% decline in July. The August increase was partly due to a 10% increase in the index for motor vehicles and parts. Manufacturing output increased 1.0%, led by primary metals (up 3.2%) and electrical equipment, appliances, and components (up 2.0%). Manufacturing of petroleum and coal products fell 2.3%. Capacity utilization moved up to 78.0% in August, a rate that is 1.7 percentage points below its long-run (1972–2023) average.
Combined business inventories of manufacturers, wholesalers, and retailers rose 0.4% in July while combined business sales increased 1.1% compared to the previous month. Motor vehicles and parts dealers have seen the biggest jump in inventories, up 23.0% compared to July of last year. The inventories-to-sales ratio was 1.37, the same as a year ago.

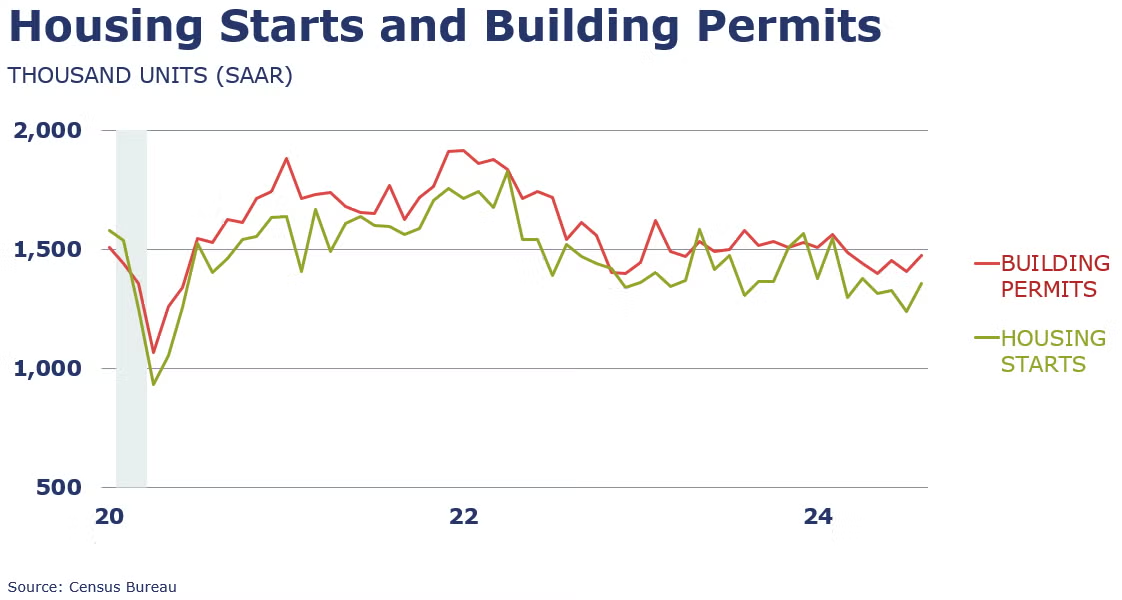
Housing starts jumped 9.6% in August to a 1.356 million seasonally adjusted annual rate (SAAR). Single-family starts were up 15.8% led by a 47.4% increase in the Northeast. Forward-looking building permits were up 4.9% compared to July, led by a 16.3% increase in multifamily homes. Compared to a year ago, building permits were down 6.5% while housing starts were up by 3.9%.
Existing home sales fell 2.5% in August to a 3.86 million seasonally adjusted annual rate, according to the NATIONAL ASSOCIATION OF REALTORS®. August sales were 4.2% lower than a year ago. Housing inventories rose 0.7% compared to July and were up 22.7% Y/Y. This represented a 4.2-month supply at the current sales pace, up from 4.1 months in July. The median existing home price for all housing types was $416,700, up 3.1% from the same time last year.

U.S. natural gas prices dropped below $2.3/MMBtu after the EIA reported a larger-than-expected storage increase. Storage levels were 8.6% above the five-year average, indicating a supply surplus. Additionally, lower cooling demand is expected due to forecasts of milder weather.
Indicators for the business of chemistry suggest a yellow banner.

According to data released by the Association of American Railroads, chemical railcar loadings were down to 32,444 for the week ending September 14. Loadings were up 4.7% Y/Y (13-week MA), up (4.2%) YTD/YTD and have been on the rise for 7 of the last 13 weeks.
U.S. chemical import prices rose by 0.1% in August and were down by 1.7% Y/Y. Chemical export prices rose by 0.1% and were by 0.6% Y/Y.
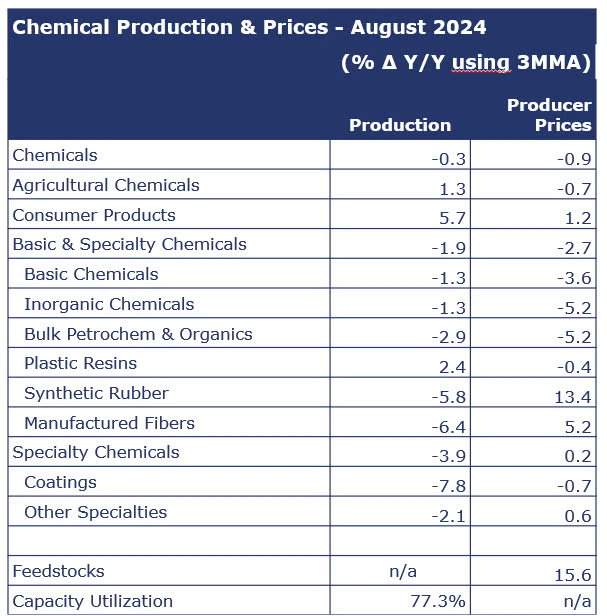
Chemical production rose 1.2% in August, with strong gains in resin and petrochemicals production, followed by moderate gains in synthetic rubber, synthetic dyes and pigments, inorganic chemicals, and industrial chemicals. Consumer products and agricultural chemicals declined compared to July. Capacity utilization for chemicals was up 1.0% to 78.1%.

U.S. production of major plastic resins totaled 8.4 billion pounds during July 2024, a decrease of 1.1% compared to the prior month, and an increase of 0.3% Y/Y, according to ACC statistics. Year-to-date production was 58.8 billion pounds, a 5.7% increase as compared to the same period in 2023. Sales and captive (internal) use of major plastic resins totaled 8.5 billion pounds during July 2024, a decrease of 1.4% compared to the prior month, and an increase of 4.9% from the same month one year earlier. Year-to-date sales and captive use were 59.1 billion pounds, an 8.3% increase Y/Y.

