Running tab of macro indicators: 12 out of 20
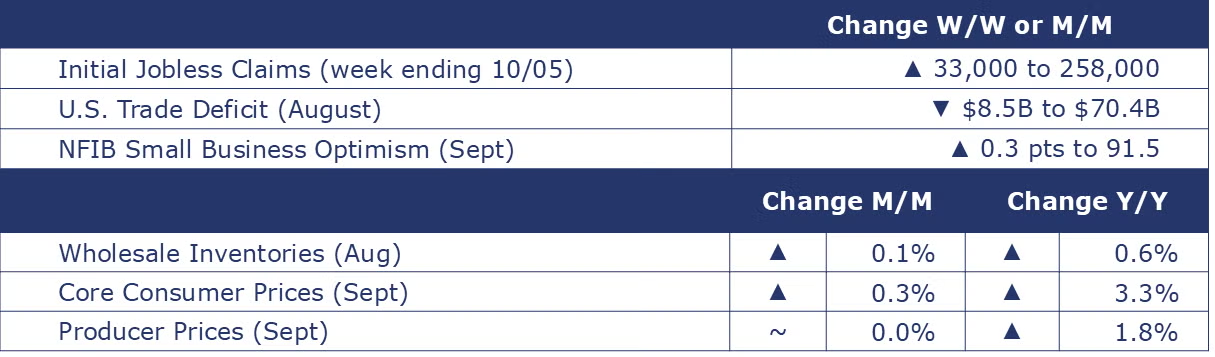
The number of new jobless claims rose by 33,000 to 258,000 during the week ending Oct 5. Continuing claims increased by 42,000 to 1.861 million, and the insured unemployment rate for the week ending Sept 28 was unchanged at 1.2%.
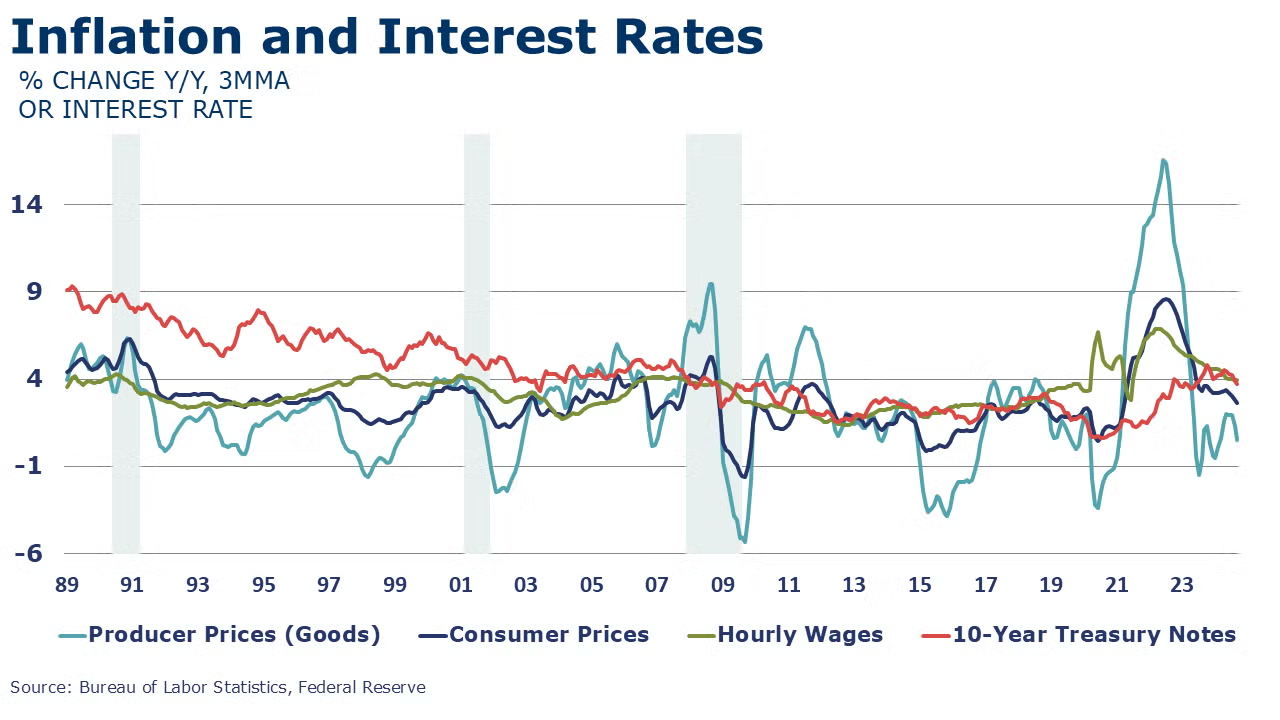
Consumer prices rose 0.2% in September, the same monthly pace as in July and August. Excluding food and energy, core consumer prices were up by 0.3% reflecting inflation in shelter, motor vehicle insurance, medical care, apparel, and airline fares. Headline consumer prices were up 2.4% Y/Y (slowest pace since Feb 2021) and core prices were up 3.3% Y/Y, slightly higher than in September.
Headline producer prices were flat in September, as lower energy prices offset higher prices for foods, core goods, and services. Compared to a year ago, the indices for headline producer prices and core final demand goods continued to ease to 1.8% Y/Y and 3.2% Y/Y respectively. The producer price index for services, however, moved higher compared to last September, up by 3.1% Y/Y (compared to a 3.0% gain in August). Stubborn services inflation complicates the Fed’s mission.
The U.S. trade deficit in goods and services narrowed by 10.8% to $70.4 billion in August as exports rose 2.0% and imports fell 0.9%. Declines in exports of semiconductors, crude oil, and other sectors were offset by gains in pharmaceuticals, autos, telecommunications equipment, civilian aircraft, industrial machinery, and other goods. Goods imports fell in autos and industrial supplies and materials (including crude oil and finished metal shapes).
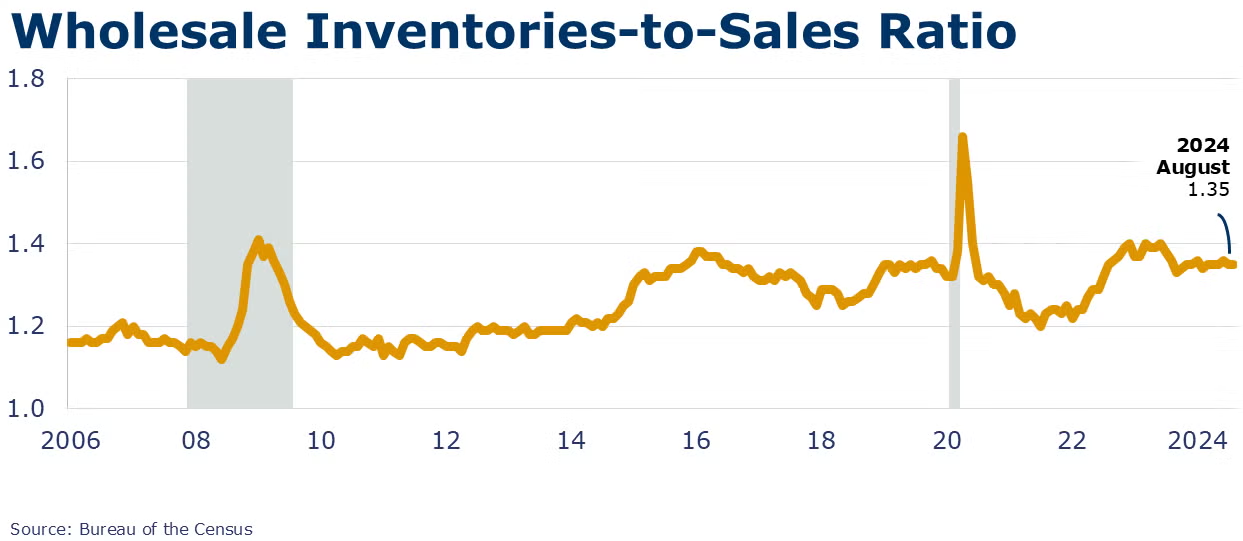
Wholesale inventories edged slightly higher in August, up by 0.1%. The largest gains were in farm products and computer equipment. Sales at the wholesale level eased slightly by 0.1%. The inventories-to-sales ratio remained steady at 1.35. Compared to a year ago, wholesale inventories were up 0.6% Y/Y while sales were up 1.1% Y/Y. Inventories have stabilized above pre-pandemic levels.
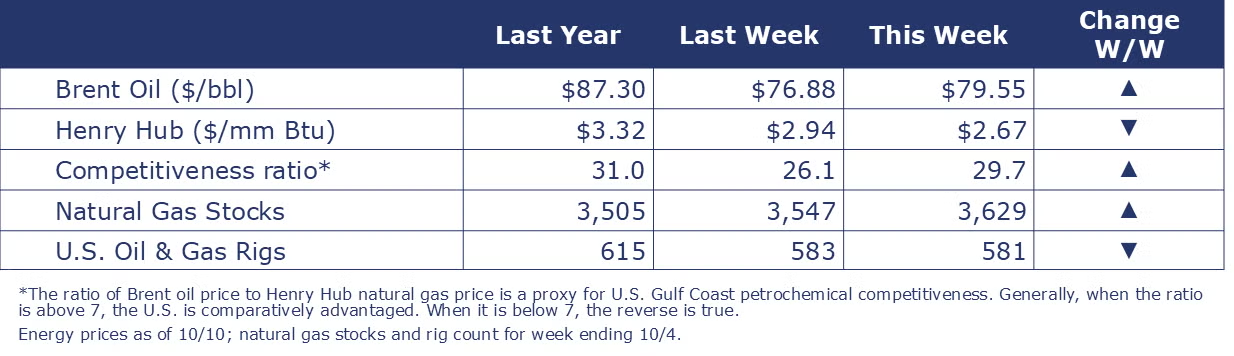
Oil prices were up compared to a week ago on stronger demand in the US (driven by a jump in fuel demand ahead of Hurricane Milton) and a rising risk of supply disruptions from the Middle East. U.S. natural gas prices continued to ease this week following better-than-expected 82 BCF inventory build last week. The combined oil and gas rig count fell by two to 581.
Indicators for the business of chemistry suggest a yellow banner.
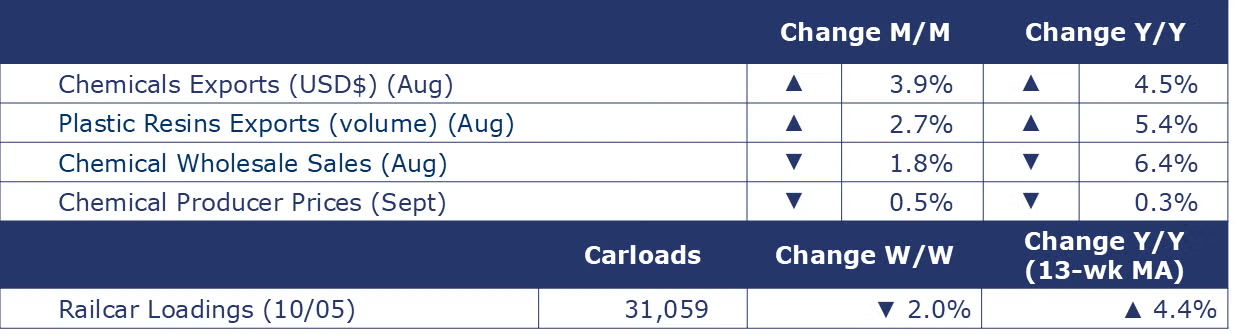
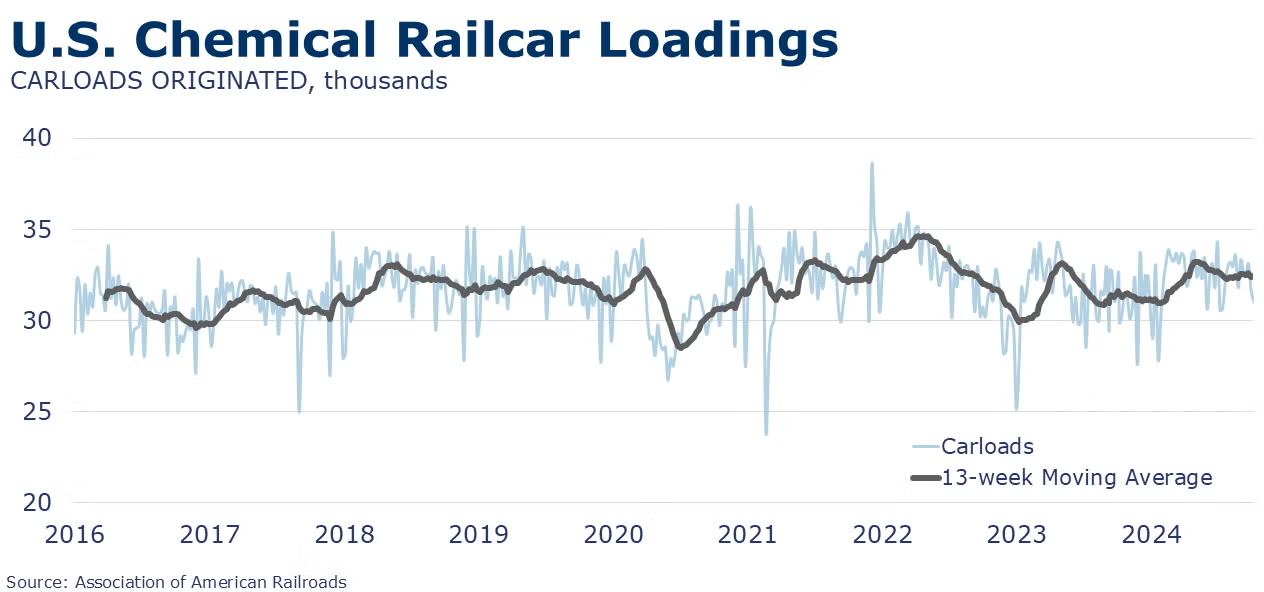
According to data released by the Association of American Railroads, chemical railcar loadings were down to 31,059 for the week ending Oct 5. Loadings were up 4.4% Y/Y (13-week MA), up (4.2%) YTD/YTD and have been on the rise for 7 of the last 13 weeks.
U.S. chemical exports were up 3.9% in August reflecting gains in all categories except synthetic rubber and fibers, other basic chemicals, and adhesives and sealants. Chemical imports were down by 5.7% as declines occurred across all categories except agricultural chemicals, plastic resins, and adhesives and sealants. The U.S. chemicals trade surplus rose to $3.5 billion in August and is $18.5 billion YTD. Compared to the same month last year, exports were up 4.5% Y/Y and imports were up 0.1% Y/Y.
U.S. plastic resins exports were up by 1.5% in August to a level up 9.3% Y/Y on a USD$ value basis. On a volume comparison, at 2.0 million metric tons exported in August, plastic resins exports were up 2.7% from July and up 5.4% Y/Y.
Producer prices for chemicals declined in September for the first time since March, down by 0.5%. Higher prices for inorganic chemicals, synthetic rubber, agricultural chemicals, coatings, and other specialty chemicals were more than offset by lower prices for plastic resins, manufactured fibers, and bulk petrochemicals & organics. Prices for consumer products were flat. Compared to a year ago, chemical prices were off by a modest 0.3% Y/Y.
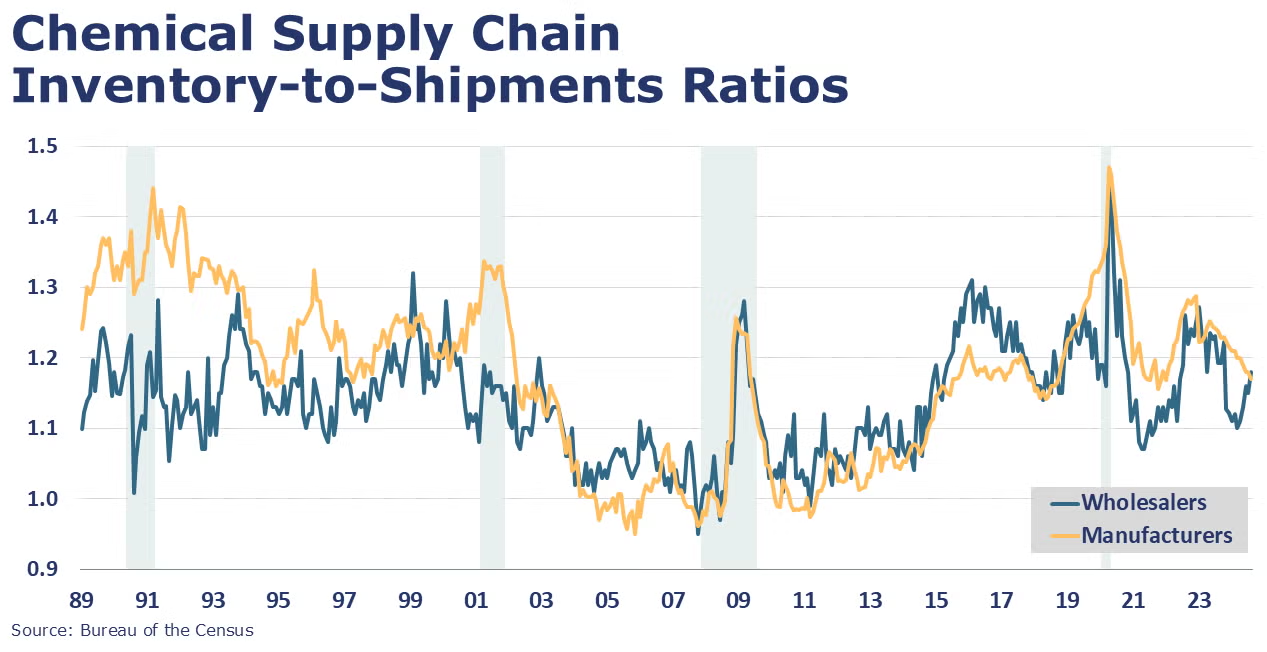
Sales of chemicals at the wholesale level fell for a fifth consecutive month in August, down by 1.8%. Chemical inventories rose, however, by 0.3%. The inventories-to-sales ratio rose from 1.15 in July to 1.18 in August, back to what it was a year earlier. Compared to a year ago, both chemical sales and inventories were 6.4% lower.
Note On the Color Codes
Banner colors reflect an assessment of the current conditions in the overall economy and the business chemistry of chemistry. For the overall economy we keep a running tab of 20 indicators. The banner color for the macroeconomic section is determined as follows:
Green – 13 or more positives
Yellow – between 8 and 12 positives
Red – 7 or fewer positives
There are fewer indicators available for the chemical industry. Our assessment on banner color largely relies upon how chemical industry production has changed over the most recent three months.
For More Information
ACC members can access additional data, economic analyses, presentations, outlooks, and weekly economic updates through ACCexchange.
In addition to this weekly report, ACC offers numerous other economic data that cover worldwide production, trade, shipments, inventories, price indices, energy, employment, investment, R&D, EH&S, financial performance measures, macroeconomic data, plus much more. To order, visit http://store.americanchemistry.com/.
Every effort has been made in the preparation of this weekly report to provide the best available information and analysis. However, neither the American Chemistry Council, nor any of its employees, agents or other assigns makes any warranty, expressed or implied, or assumes any liability or responsibility for any use, or the results of such use, of any information or data disclosed in this material.
Contact us at ACC_EconomicsDepartment@americanchemistry.com.