Running tab of macro indicators: 10 out of 20
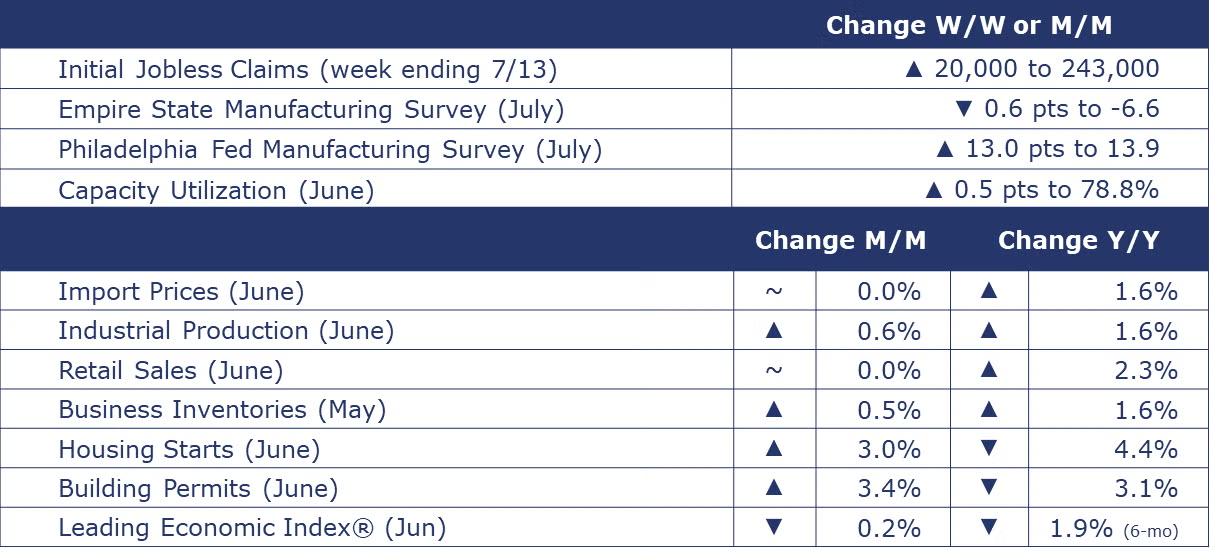
The number of new jobless claims rose by 20,000 to 243,000 during the week ending July 13. Continuing claims increased by 20,000 to 1.867 million, and the insured unemployment rate for the week ending July 6 was unchanged at 1.2%.
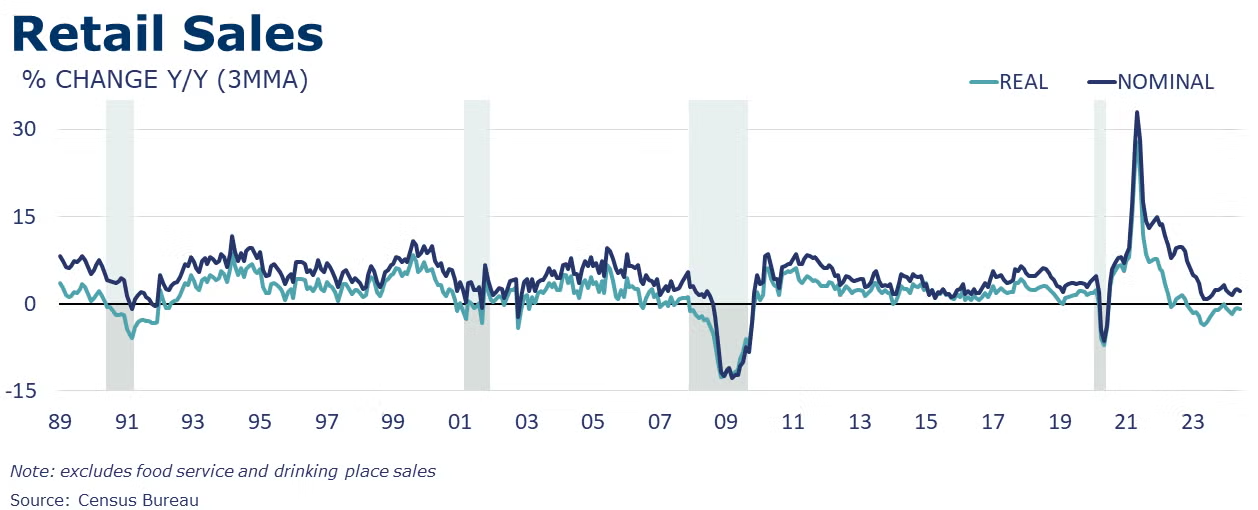
Following an upwardly revised gain in May, food service & retail sales were flat in June. Sales at gas stations and auto dealers were sharply lower reflecting lower gasoline prices and a multi-day cyberattack that disrupted vehicle sales. Excluding those two segments, retail sales were up by 0.8%, the highest monthly gain since January 2023, suggesting the US consumer still has legs. The largest percentage gains were in online shopping and building material & garden centers. Compared to last June, retail sales were up 2.3% Y/Y.
Headline import prices were flat in June following a 0.2% decline in June. A decline in fuel prices offset a gain in prices for nonfuel imports. Export prices continued to move lower for a second month, down by 0.5%. Compared to a year ago, import prices were up 1.6% Y/Y while export prices were up 0.7% Y/Y.
Business inventories expanded by 0.5% in May, setting up a positive contribution from inventories in next week’s Q2 GDP report. Inventories expanded across all major segments with the largest gains in retailers and wholesalers. Business sales were flat as lower sales at manufacturers were offset by higher sales at the wholesale and retail level. Compared to a year ago, sales were up 2.0% Y/Y while inventories were up 1.6% Y/Y. The inventories-to-sales ratio remained stable at 1.37.
Following a decline in May, housing starts rose in June, up by 3.0%. Forward-looking building permits also rose, up by 3.4%. For both starts and permits, the gains were entirely in multi-family; single-family activity was lower during the month in both series. Compared to a year ago, headline housing starts were off 4.4% while building permits were off 3.1% Y/Y. In the single-family sector, starts were up 5.4% Y/Y while permits were off 1.3% Y/Y. Separately, builder confidence in the market for new single-family homes fell to 42 in July, down one point from the previous month, according to NAHB/Wells Fargo.
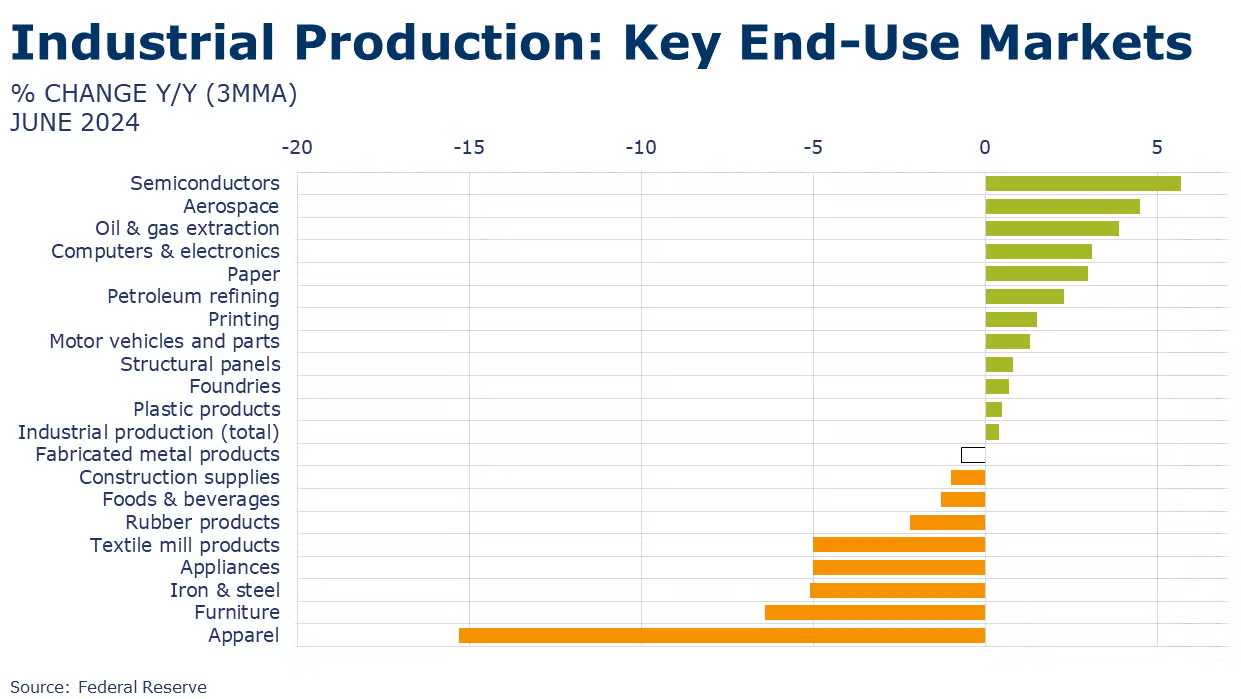
Industrial production decelerated in June, expanding by a slower 0.6%, compared to a 0.9% gain in May. Mining, utility, and manufacturing output all expanded. Within manufacturing, the largest gains were in motor vehicles and parts, electrical equipment, furniture, aerospace, nonmetallic mineral products, textiles, apparel, printing, paper and chemicals. These gains were partially offset by declines in primary metals, metal products, and miscellaneous durable goods. Compared to a year ago, manufacturing output was up by 1.1%, while headline industrial production was up 1.6% Y/Y. The capacity utilization rate moved higher by 0.5 percentage points to 78.8%. This was slightly higher than last June’s 78.6%. Over the same time, overall capacity was higher by 1.4% Y/Y.
The contractionary trend in the Conference Board’s Leading Economic Index® (LEI) decelerated in June, dropping 0.2% following a 0.4% decline in May. Over the first half of 2024, the LEI has contracted by 1.9%, less than the 2.9% contraction over the second half of 2023. The Conference Board sees signals of slowing momentum in the coming months leading toward a slow recovery (not recession). The LEI’s June decline was attributed to weakened consumer sentiment, weak new orders, negative interest rate spread, and higher initial claims for unemployment.
BEIGE BOOK
A compilation of anecdotal information on the regional economies in the 12 districts, the Beige Book is published eight times per year. Interesting excerpts follow here:
- Economic activity maintained a modest pace of growth in a majority of Districts this reporting cycle. However, while seven Districts reported some level of increase in activity, five noted flat or declining activity—three more than in the prior reporting period.
- Wages continued to grow at a modest to moderate pace in most Districts, while prices were generally reported to have risen modestly.
- Household spending was little changed this period according to most District banks.
- Auto sales varied across Districts this cycle, but some Districts noted that sales were lower due in part to a cyberattack on dealerships and high interest rates.
- Most Districts saw soft demand for consumer and business loans.
- Reports on residential and commercial real estate markets varied, but most banks reported only slight changes, if any, in recent weeks.
- Travel and tourism grew steadily and was on par with seasonal expectations.
- Agricultural conditions varied in tandem with sporadic droughts across the nation.
- Districts also reported widely disparate trends in manufacturing activity ranging from brisk downturn to moderate growth.
- Retail restocking spurred slight growth in transportation activity.
- Tight capacity in ocean shipping led to a surge in spot rates.
- Expectations for the economy over the coming six months are for slower growth due to uncertainty around the upcoming election, domestic policy, geopolitical conflict, and inflation.
SURVEY OF ECONOMIC FORECASTERS
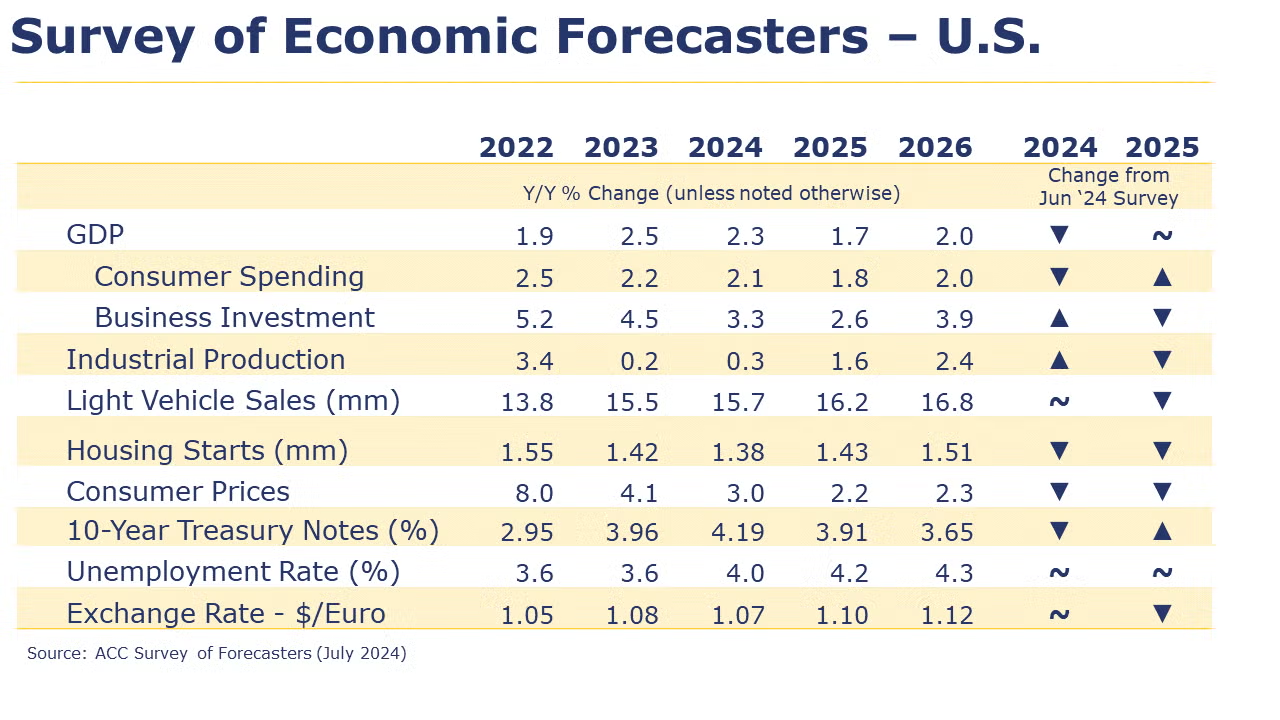
- At the start of Q3, the US economy continues to expand though growth is expected to downshift in the second half of the year.
- U.S. GDP is expected to grow by 2.3% in 2024 and by 1.7% in 2025.
- Consumer spending growth is expected slow to a 2.1% Y/Y pace in 2024 and ease further to a 1.8% gain in 2025.
- Despite higher borrowing costs and election uncertainty, business investment is expected to grow by 3.3% 2024 (down from last year, but higher than expected earlier in the year). Business investment growth slows to 2.6% in 2025.
- Following a 0.2% gain in 2023, we look for industrial production to come in around the same pace (0.3%) in 2024 before firming to a 1.6% pace in 2025. Growth is uneven among industries, however.
- Sales of autos and light trucks are expected to grow to 15.7 million in 2024 (still below trend) before rising to a 16.2 million pace in 2025.
- Higher mortgage rates continue to dent housing demand. Housing starts are expected to come in at 1.38 million in 2024 before rising to a 1.43 million pace in 2025 as mortgage rates ease next year.
- The unemployment rate is expected to move higher as the labor market rebalances averaging 4.0% in 2024 and 4.2% in 2025.
- Recent data shows that inflation remains above the Fed’s target, though progress toward 2% continues. Growth in consumer prices is expected to slow to a 3.0% pace in 2024 and 2.2% in 2025.
- With more signs that inflation is coming down and growing concerns that the labor market may be nearing an inflection point, hopes have risen that the Fed will start to cut rates in September. As a result, expectations for 10-year Treasury yields were revised slightly lower for 2024.
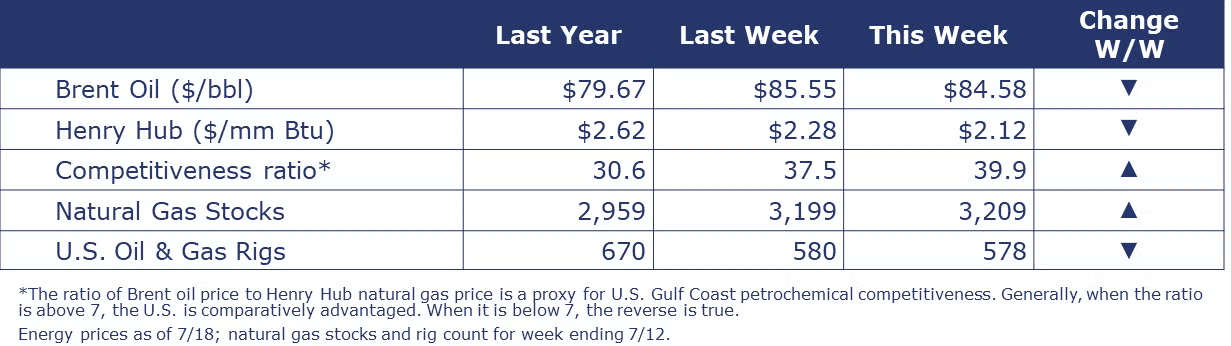
Oil prices eased from a week ago as concerns about Chinese demand growth offset evidence of stronger demand in the U.S. Natural gas prices continued to fall as strong production and lower demand are keeping storage levels high. Natural gas demand has been lower than it was before Beryl due to the offline Freeport LNG export terminal, damaged during Hurricane Beryl, in addition to massive power outages in Texas that reduced natural gas burn at electric generators. The combined oil and natural gas rig count fell by two to 578 last week, marking the fifth decline in six weeks.
Indicators for the business of chemistry suggest a yellow banner.
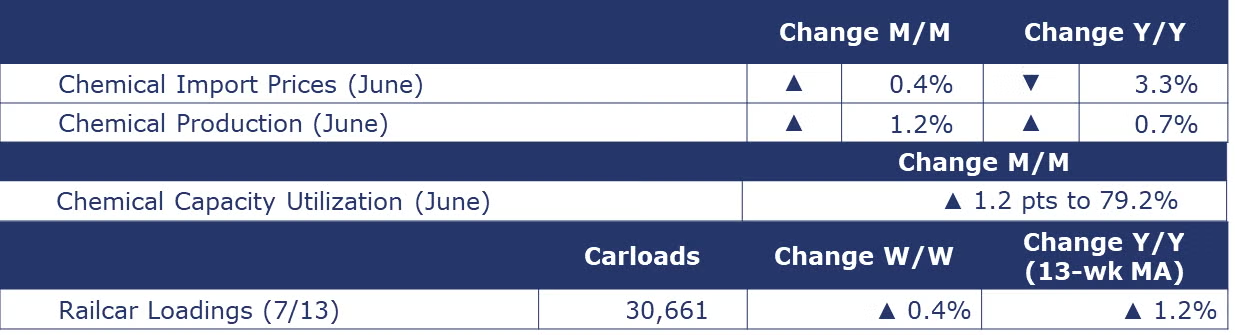
According to data released by the Association of American Railroads, chemical railcar loadings were up to 30,661 for the week ending July 13. Loadings were up 1.2% Y/Y (13-week MA), up (4.2%) YTD/YTD and have been on the rise for 8 of the last 13 weeks.
Comments from the Fed Beige Book specific to chemicals:
- “Chemical producers described a softening across most segments, particularly chemicals produced for housing, automotive, and advanced materials; however, the pharmaceuticals segment remained strong.” (Atlanta District)
- “Among nondurables, food and chemical manufacturers saw a notable increase in new orders, and Gulf Coast refiners cited robust utilization rates.” (Dallas District)
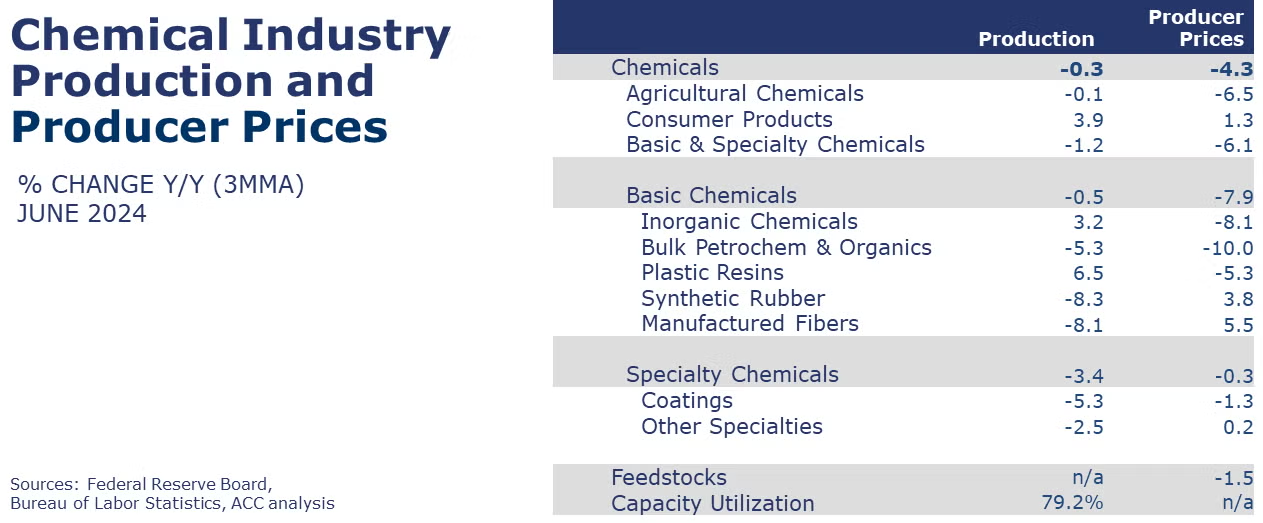
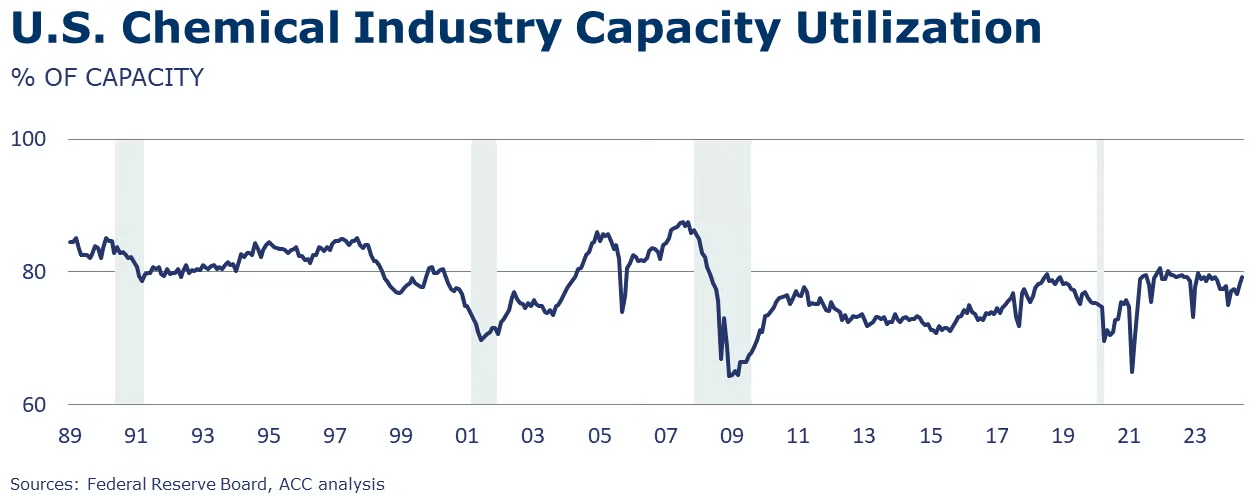
Chemical production rose for a second consecutive month in June, up by 1.2%. There were gains in the output of all categories, except for coatings, which declined. Compared to a year ago, chemical production was up by 0.7%. Chemical capacity utilization rose 1.2 points to 79.2%, only slightly lower than last year’s 79.6% utilization rate. Over the past year, chemical capacity expanded by 1.1%.
Chemical import prices rose by 0.4% in June, following four consecutive months of decline. Export prices were off by 0.5% for a second consecutive month. Compared to a year ago, chemical import prices were off by 3.3% Y/Y while export prices were down 2.9% Y/Y.
Note On the Color Codes
Banner colors reflect an assessment of the current conditions in the overall economy and the business chemistry of chemistry. For the overall economy we keep a running tab of 20 indicators. The banner color for the macroeconomic section is determined as follows:
Green – 13 or more positives
Yellow – between 8 and 12 positives
Red – 7 or fewer positives
There are fewer indicators available for the chemical industry. Our assessment on banner color largely relies upon how chemical industry production has changed over the most recent three months.
For More Information
ACC members can access additional data, economic analyses, presentations, outlooks, and weekly economic updates through ACCexchange.
In addition to this weekly report, ACC offers numerous other economic data that cover worldwide production, trade, shipments, inventories, price indices, energy, employment, investment, R&D, EH&S, financial performance measures, macroeconomic data, plus much more. To order, visit http://store.americanchemistry.com/.
Every effort has been made in the preparation of this weekly report to provide the best available information and analysis. However, neither the American Chemistry Council, nor any of its employees, agents or other assigns makes any warranty, expressed or implied, or assumes any liability or responsibility for any use, or the results of such use, of any information or data disclosed in this material.
Contact us at ACC_EconomicsDepartment@americanchemistry.com.