Running tab of macro indicators: 11 out of 20
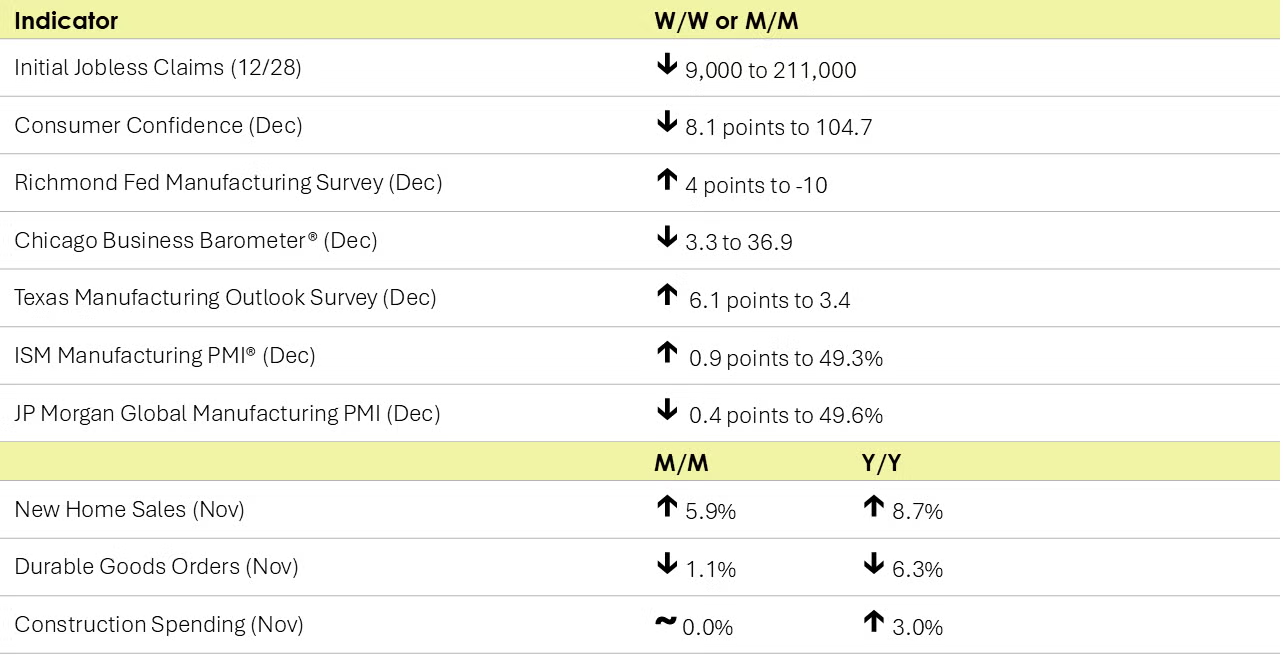
Reflecting in part the Christmas holiday, the number of new jobless claims fell by 9,000 to 211,000 during the week ending 28 December. Continuing claims fell by 52,000 to 1.844 million, and the insured unemployment rate for the week ending 21 December was down slightly to 1.2%.
Consumer confidence sank in December, down 8.1 points to 104.7. Consumers’ assessment of the present situation weakened, and expectations tumbled. The expectations index fell sharply to a level just above that which usually signals a recession. Concerns about inflation continued to be a concern. Likely reflecting higher mortgage rates, purchasing plans for homes were down slightly in December. Plans to purchase autos continued to increase. While more consumers planned to buy big-ticket items over the next six months than not, consumer buying plans for most appliances and electronics were still down.
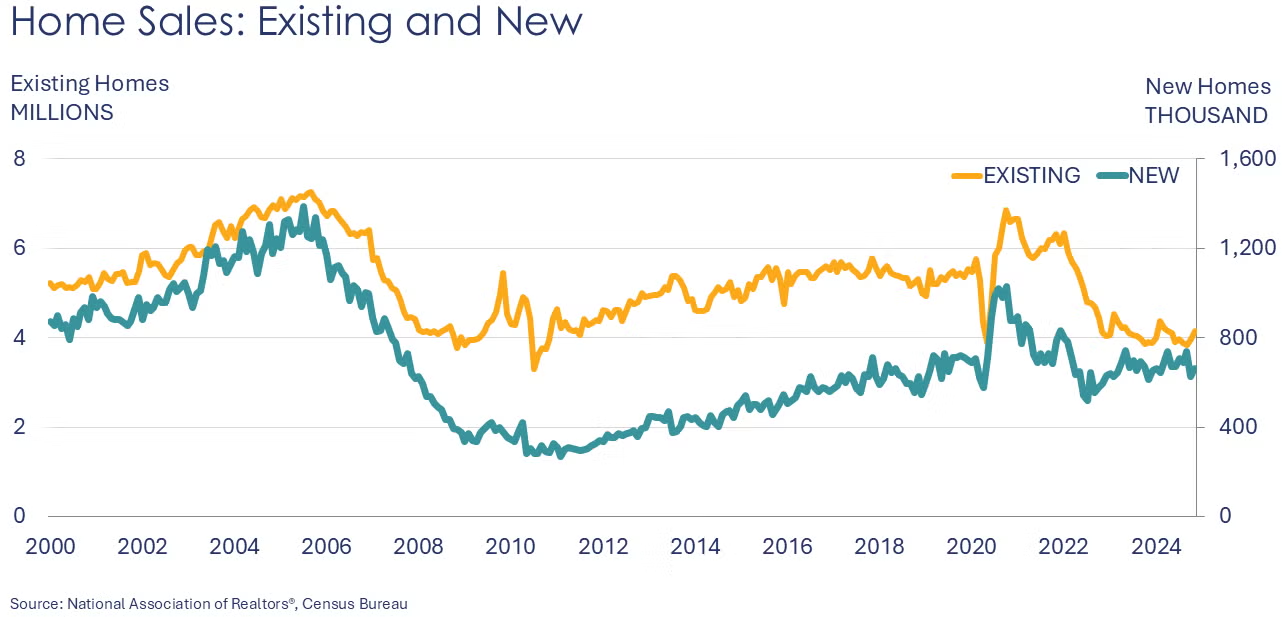
Following a 14.8% decline in October (likely related to hurricane disruptions), new single-family home sales rose 5.9% in November. Sales were up 8.7% from a year earlier. Inventories expanded by 2.1%, representing an 8.9-month supply. Inventories of newly built unsold homes rose to 490 million, the highest in nearly 17 years. The median sales price fell 6.3% from a year earlier to $402,600.
Construction spending was flat in November following an increase in October. Spending on private residential projects edged slightly higher but was offset by slightly lower spending on publicly funded projects. Private nonresidential construction spending was flat. Overall construction spending was up 3.0% Y/Y with gains across all three segments.
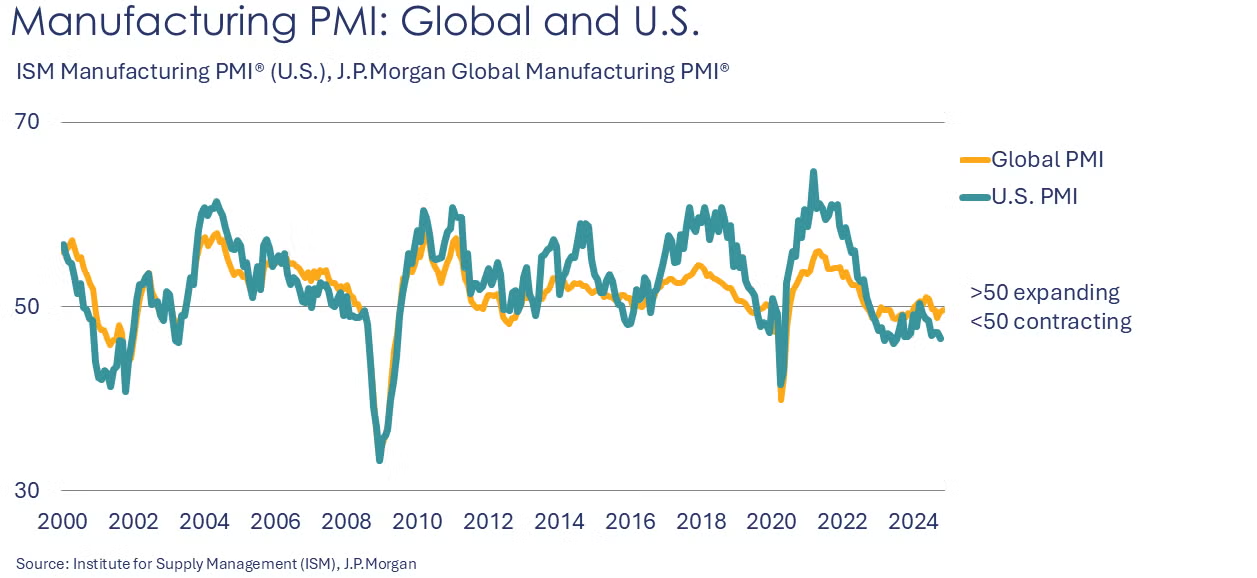
Manufacturing activity continued to ease in December, but at a softer pace than in previous months. The ISM Manufacturing PMI® rose 0.9 points to 49.3% with seven industries reporting growth, including primary metals, electrical equipment & appliances, wood products, furniture, paper, miscellaneous manufacturing and plastic & rubber products. New orders rose at a faster rate and production expanded. Employment, however, contracted at a faster pace. New export orders were unchanged and both inventories and imports contracted at a slower pace. Electrical and electronic components were reported to be in short supply.
The JP Morgan Global Manufacturing PMI eased in December, falling 0.4 points to 49.6%, suggesting that global manufacturing activity contracted at the end of the year. Output and new orders declined (after expanding in November) and new export orders declined at a faster pace. Strong growth in India and a slight expansion in China offset downturns in Germany, France, the US and UK. Within sectors, there was lower production in the intermediate and investment goods industries, in contrast to continued gains in the output of consumer goods.
New orders for durable goods eased in November, down 1.1%. Despite the end of the Boeing strike on November 5th, aircraft orders declined. Orders for motor vehicles & parts, fabricated metal products and electronic products were also lower. Orders for primary metals, machinery, computers, and electrical equipment were higher than a month ago. Core business orders (nondefense capital goods excluding aircraft) were up 0.7% following a small decline in October. Compared to a year ago, headline durable orders were off 6.3% Y/Y, while core business orders were essentially flat.
The Chicago Business Barometer® continued to sink, falling 3.3 points to 36.9, its lowest point since May 2024. Conversely, the Dallas Fed’s Texas Manufacturing Outlook survey pointed to a slight expansion as its index of general business activity rose to 6.1 points to +3.4.

- Oil prices were higher on greater optimism for China’s economy after its manufacturing PMI signaled expansion for a third consecutive month.
- U.S. natural gas prices remained steady at last week’s higher levels in anticipation of cold weather arriving.
- In Europe, the benchmark TTF natural gas price rose above €50.0 per MWh (equivalent to ~$15/mmbtu) as Ukraine stopped allowing deliveries of Russian gas to Europe following the expiration of a 5-year transit deal.
- The combined oil & gas rig count remained steady for a third week at 585.
Indicators for the business of chemistry suggest a yellow banner.

According to data released by the Association of American Railroads, chemical railcar loadings were up to 35,174 for the week ending December 21. Loadings were up 4.2% Y/Y (13-week MA), up 4.1% YTD/YTD and have been on the rise for 6 of the last 13 weeks.
Within the details of the ISM Manufacturing PMI® report, the chemical industry was one of seven industries that contracted in December. Production, employment, inventories, order backlogs and new export orders were lower, customers’ industries were deemed “too low”, and supplier deliveries were reported to be faster. Raw material prices were lower. One respondent from the chemical products sector reported, “Slightly lower [activity] due to seasonality and end-of-year destocking.”
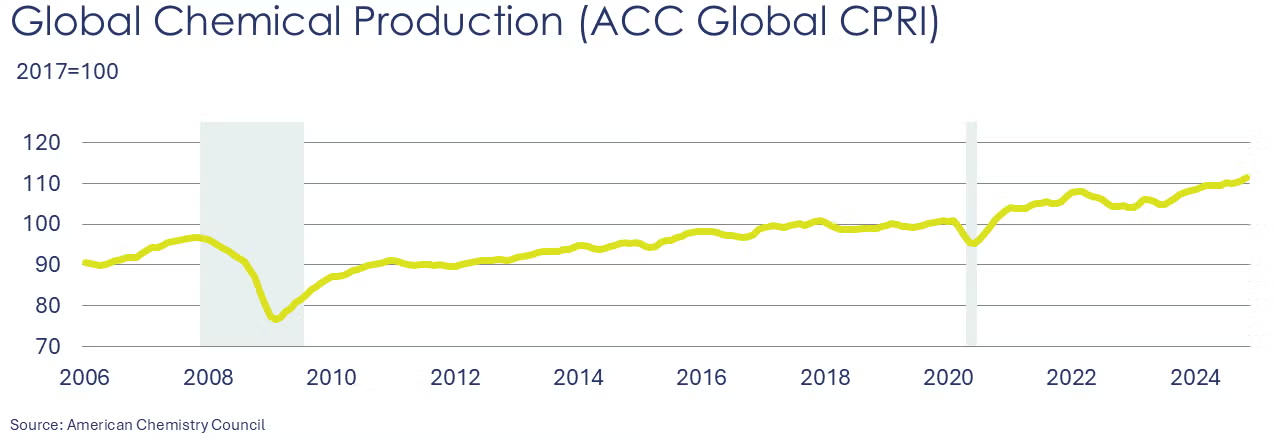
Following an improvement (0.5%) in October, ACC’s Global Chemical Production Regional Index (Global CPRI) advanced (0.6%) in November. Strength in Asia, North America, South America, and the former Soviet Union offset continued declines in Europe. China continued to contribute to global growth despite a recent slowdown. U.S. production also improved and is now higher than the year prior. Germany’s recovery paused as the economy struggled with a weak manufacturing sector. This month, Argentina’s output jumped 8.0% as the economy regained footing after the year-long recession. Gains were recorded across all segments. Global chemicals production growth was up 3.3% Y/Y.
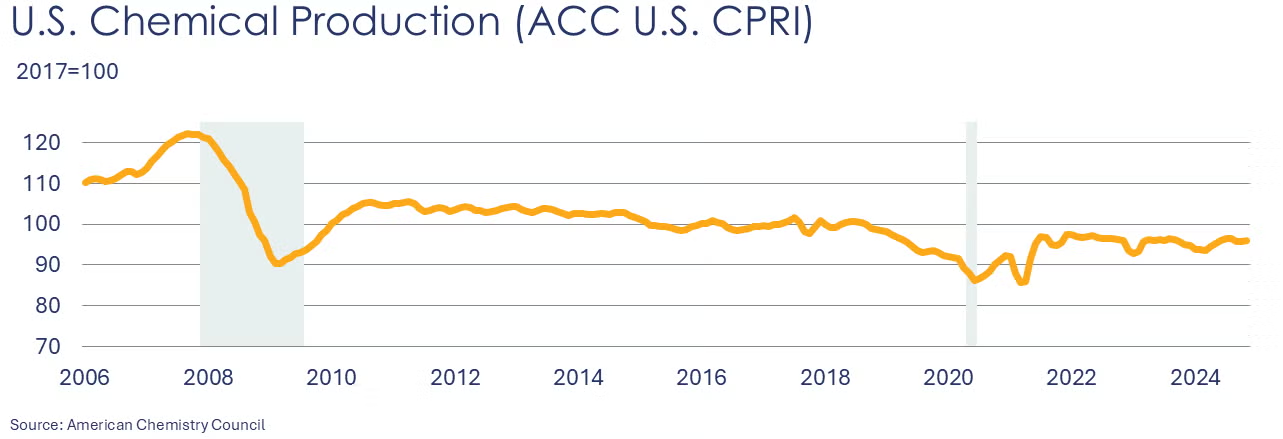
Following a 0.2% gain in October, the U.S. CPRI rose another 0.2% in November. The CPRI measures chemical production trends on a three-month moving average (3MMA) to smooth month-to-month volatility. Chemical production advanced in all regions, with the Northeast region gaining the most. The U.S. CPRI was 1.1% higher than a year ago.
Note On the Color Codes
Banner colors reflect an assessment of the current conditions in the overall economy and the business chemistry of chemistry. For the overall economy we keep a running tab of 20 indicators. The banner color for the macroeconomic section is determined as follows:
Green – 13 or more positives
Yellow – between 8 and 12 positives
Red – 7 or fewer positives
There are fewer indicators available for the chemical industry. Our assessment on banner color largely relies upon how chemical industry production has changed over the most recent three months.
For More Information
ACC members can access additional data, economic analyses, presentations, outlooks, and weekly economic updates through ACCexchange: https://accexchange.sharepoint.com/Economics/SitePages/Home.aspx
In addition to this weekly report, ACC offers numerous other economic data that cover worldwide production, trade, shipments, inventories, price indices, energy, employment, investment, R&D, EH&S, financial performance measures, macroeconomic data, plus much more. To order, visit http://store.americanchemistry.com/.
Every effort has been made in the preparation of this weekly report to provide the best available information and analysis. However, neither the American Chemistry Council, nor any of its employees, agents or other assigns makes any warranty, expressed or implied, or assumes any liability or responsibility for any use, or the results of such use, of any information or data disclosed in this material.
Contact us at ACC_EconomicsDepartment@americanchemistry.com.

