Running tab of macro indicators: 10 out of 20
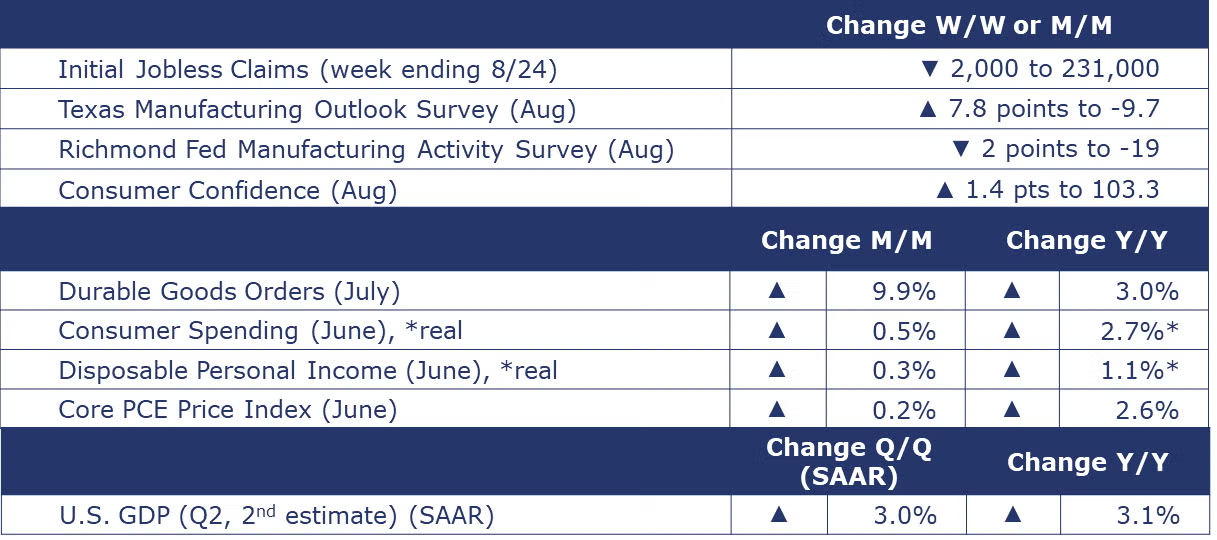
The number of new jobless claims fell by 2,000 to 231,000 during the week ending 24 August. Continuing claims increased by 13,000 to 1.868 million, and the insured unemployment rate for the week ending 17 August
was unchanged at 1.2%.
Consumer spending rose 0.5% in July led by an acceleration in spending on goods. Services spending continued to rise. Disposable personal income rose 0.3%. Adjusted for inflation, real consumer spending was up 2.7% Y/Y while disposable personal income was up 1.1% Y/Y. Annual growth in the price index for personal consumption expenditures (PCE) held steady at 2.5% Y/Y in July. Excluding food and energy, growth in the core PCE price index remained stable for a third consecutive month at 2.6% Y/Y. The core PCE price index is the one Fed officials would like to see return to its 2% target.
In its second estimate for the quarter, BEA estimated that real GDP rose at a 3.0% seasonally adjusted annual rate in Q2. This is an upward revision from the first estimate of 2.8% and more than double the pace of growth in Q1. The upward revision to Q2 growth primarily reflects an upward revision to consumer spending. Compared to a year ago, GDP was 3.1% higher. Growth in the price index for GDP rose from 2.4% Y/Y in Q1 to 2.6% Y/Y in Q2. Excluding food and energy, the core GDP price index edged higher from 2.7% Y/Y to 2.8% Y/Y.
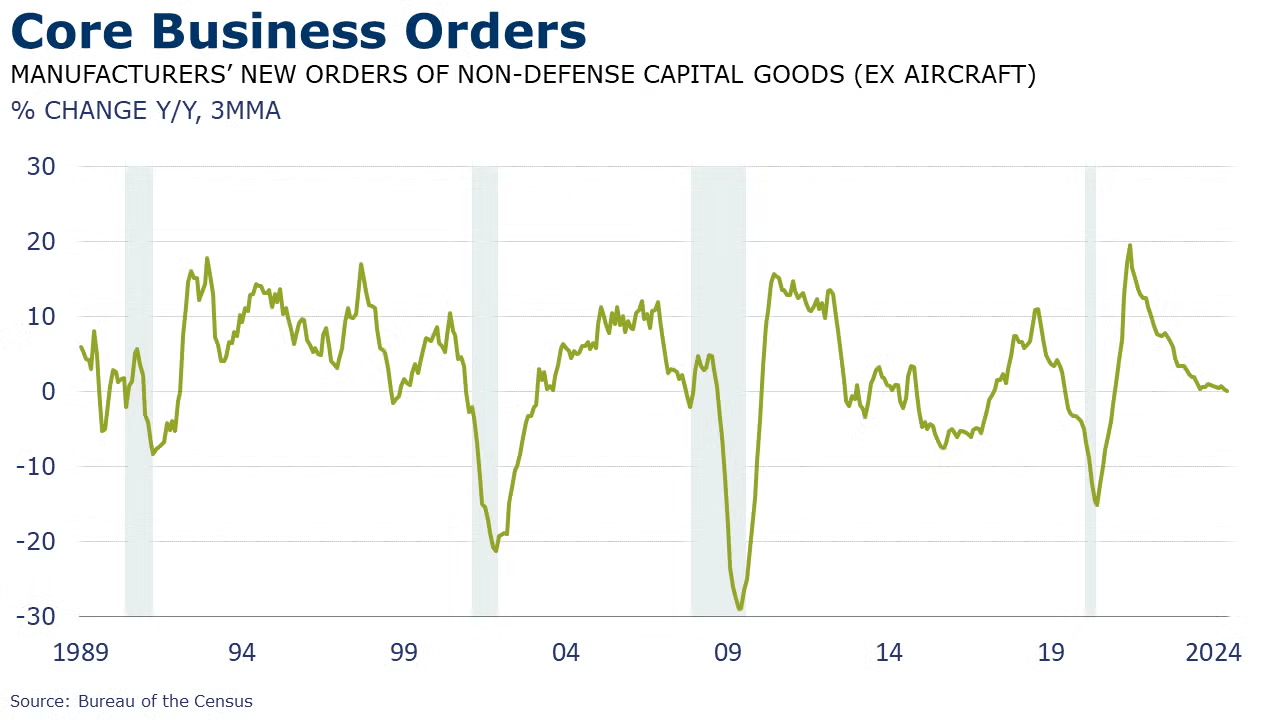
Orders for durable goods jumped 9.9% in July following a 6.9% decline in June. The swing was driven by a strong recovery in new orders for civilian aircraft. Orders were also higher for defense aircraft, computers and fabricated metal products. These gains were offset by lower orders for motor vehicles, primary metals, communications equipment, and electrical equipment. Core business orders (nondefense capital goods excluding aircraft) eased slightly (down 0.1%) following a 0.5% gain in June. Compared to a year ago, headline durable orders were up 3.0% while core business orders were 2.1% higher.
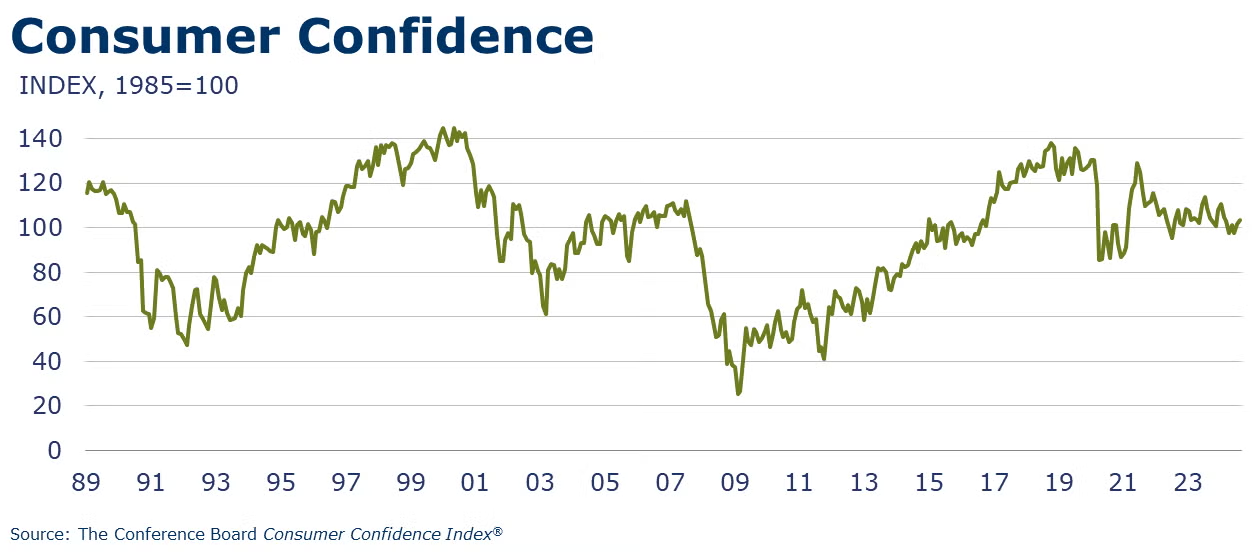
The Conference Board’s Consumer Confidence Index® rose 1.4 points to 103.3 in August. Consumers’ assessment of current business improved and was more positive. Their assessment of the labor market deteriorated slightly. Their short-term outlook for business conditions was more optimistic in August while expectations about jobs were less optimistic and their outlook for income prospects was more pessimistic with about 13% expecting their incomes to decrease. Consumers see their family’s current financial situation weakening but expect it to be better six months in the future. About 2/3 of consumers think that a U.S. recession over the next 12 months is “somewhat or very likely”.
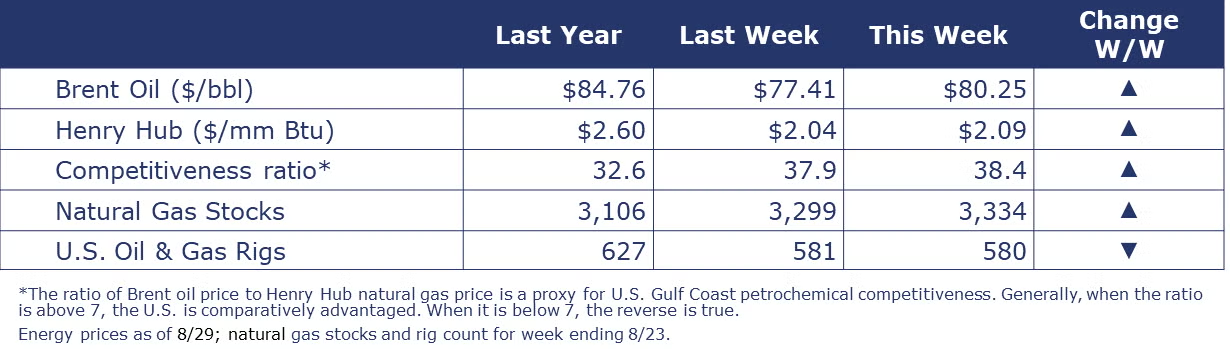
Oil prices were higher compared to a week ago as concern about Libyan supply offset soft demand in China and risks of a broader slow down. U.S. natural gas remained near $2/mmbtu as storage levels continue to build. The combined oil & gas rig count fell by 1 to 580 during the week ending 23 August.
Indicators for the business of chemistry suggest a yellow banner.
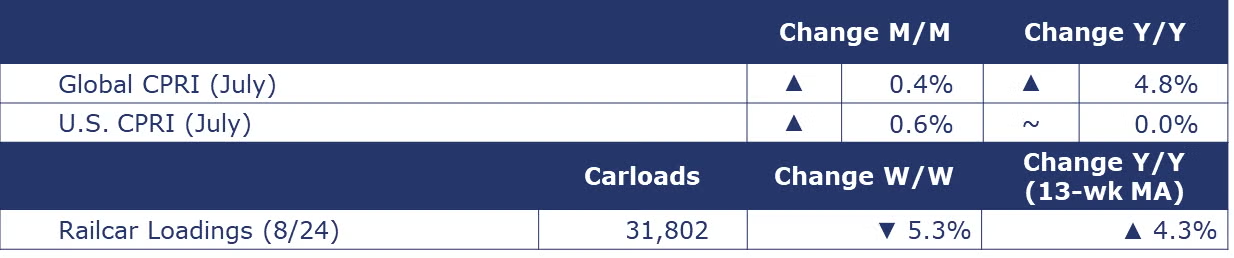
According to data released by the Association of American Railroads, chemical railcar loadings were down to 31,802 for the week ending 24 August. Loadings were up 4.3% Y/Y (13-week MA), up (4.3%) YTD/YTD and have been on the rise for 8 of the last 13 weeks.
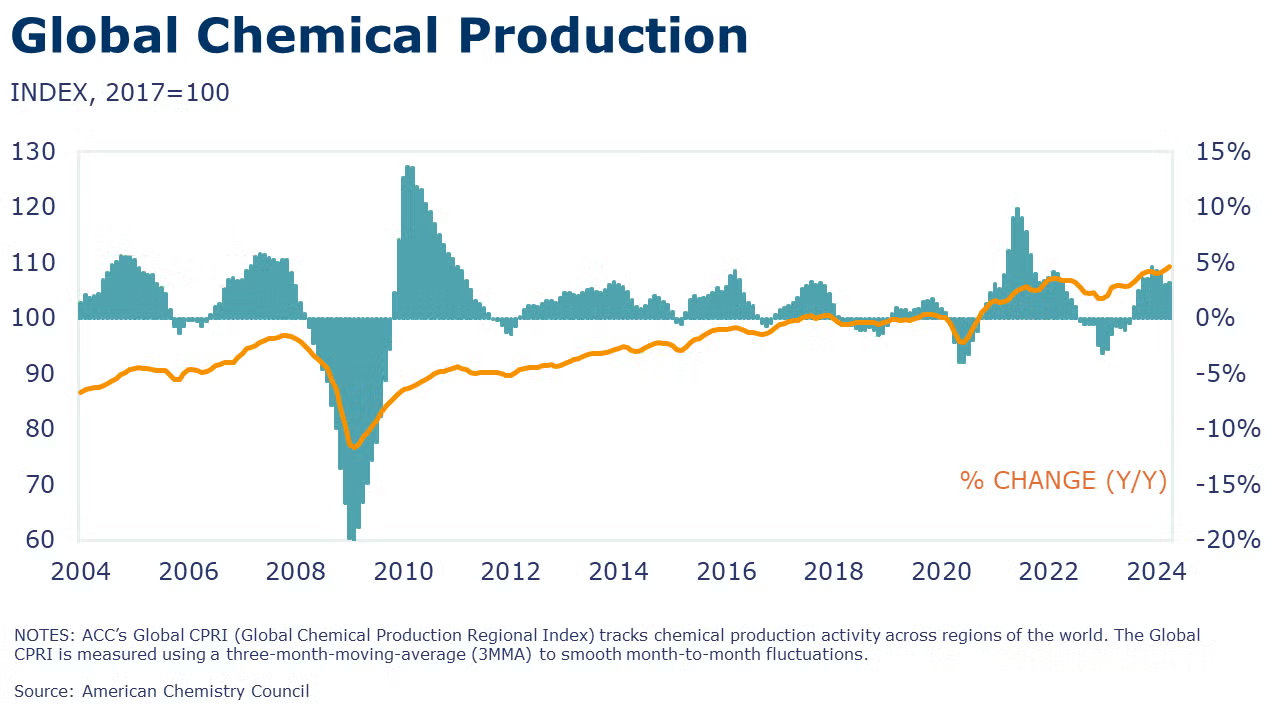
Following a 0.4% gain in June, ACC’s Global Chemical Production Regional Index (Global CPRI) advanced 0.4% in July. All regions registered growth this month. Major producers such as the United States, China, and Germany recorded gains, while Japanese production declined. Taiwan saw improvements as exports picked up, while Brazil struggled with issues related to low-capacity utilization rates. Korea’s exports showed renewed strength despite a slowing production. All segments recorded gains. Global chemicals production growth was up 4.8% Y/Y.
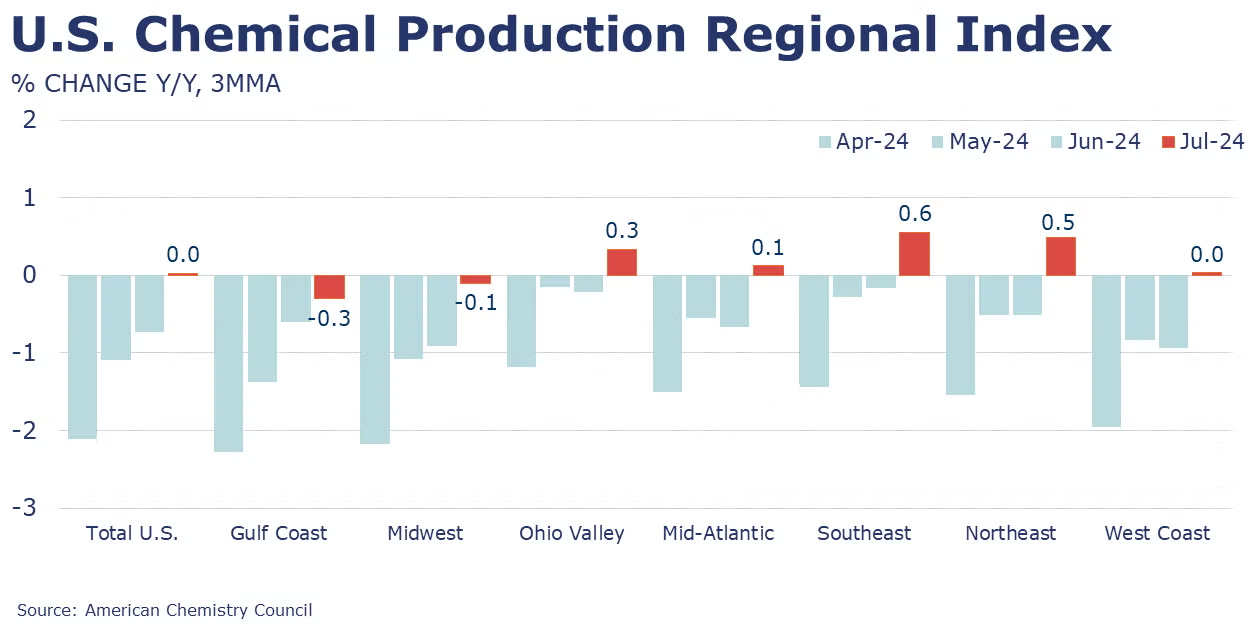
Following a 0.6% gain in June, the U.S. CPRI expanded for a fourth month, up by 0.6% in July. The U.S. CPRI measures chemical production trends on a three-month moving average (3MMA) to smooth month-to-month volatility. Chemical production rose across all regions in July. The most significant increases were in the Midwest and West Coast regions. On a year-over-year basis, the U.S. CPRI stabilized in July (0.0%) after four months of negative growth.
Note On the Color Codes
Banner colors reflect an assessment of the current conditions in the overall economy and the business chemistry of chemistry. For the overall economy we keep a running tab of 20 indicators. The banner color for the macroeconomic section is determined as follows:
Green – 13 or more positives
Yellow – between 8 and 12 positives
Red – 7 or fewer positives
There are fewer indicators available for the chemical industry. Our assessment on banner color largely relies upon how chemical industry production has changed over the most recent three months.
For More Information
ACC members can access additional data, economic analyses, presentations, outlooks, and weekly economic updates through ACCexchange.
In addition to this weekly report, ACC offers numerous other economic data that cover worldwide production, trade, shipments, inventories, price indices, energy, employment, investment, R&D, EH&S, financial performance measures, macroeconomic data, plus much more. To order, visit http://store.americanchemistry.com/.
Every effort has been made in the preparation of this weekly report to provide the best available information and analysis. However, neither the American Chemistry Council, nor any of its employees, agents or other assigns makes any warranty, expressed or implied, or assumes any liability or responsibility for any use, or the results of such use, of any information or data disclosed in this material.
Contact us at ACC_EconomicsDepartment@americanchemistry.com.

