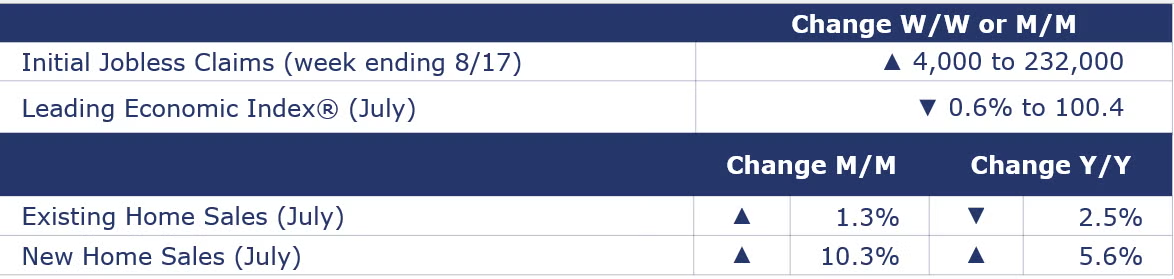
Existing home sales rose by 1.3% in July to a 3.95 million seasonally adjusted annual rate. July sales were 2.5% lower than a year ago. Housing inventories rose 0.8% in July and were up 19.8% Y/Y. This represented a 4.0-month supply at the current sales pace, down from 4.1 months in June, but up from 3.3 months in July 2023. The median existing-home price for all housing types up 4.2% Y/Y, up for a 13th consecutive month.
New home sales also rose, up 10.6% in July with gains across all regions. At a 739,000 seasonally adjusted annual rate, it was the highest pace since May 2023. Compared to a year ago, new home sales were up 5.6% Y/Y. Inventories of unsold homes at the end of July eased by 1.1%, but were 8.2% higher than a year ago. As a result, the months’ supply (at the current sales pace) fell from 8.4 months in June to 7.5 months in July. At $429,800, the median sales price was 1.4% lower than a year ago.
The Conference Board’s Leading Economic Index® fell 0.6% in July, down for a 29th consecutive month. July’s decline was led by deterioration in new orders, weak consumer expectations of business conditions, and softer building permits and manufacturing hours worked. Over the past six months, the index was down 2.1%, suggesting weak growth ahead, but not recession.
Global semiconductor sales rose 1.7% in June, led by higher sales in the Americas. Sales were also higher in Japan and China but fell in Europe and Asia Pacific/All Other. Compared to a year ago, global sales were up 18.3% Y/Y with the Americas region up by nearly 43%. Y/Y.
Survey of Economic Forecasters
- Moving through Q3, the US economy continues to expand, however, July’s weak jobs report suggests the economy is slowing.
- U.S. GDP is expected to grow by 2.5% in 2024 and by 1.6% in 2025.
- Growth in consumer spending is expected to remain stable (compared to 2023) at a 2.2% pace in 2024 and ease in 2025 to a 1.6% gain.
- Business investment has remained stronger than expected despite higher borrowing costs and is expected to grow by 3.8% in 2024 before slowing to a 2.6% pace in 2025.
- Following a 0.2% gain in 2023, we look for industrial production to grow at a similar pace (0.4%) in 2024 before firming to a 1.2% pace in 2025. Growth is uneven among industries, however.
- Sales of autos and light trucks are expected to grow to 15.7 million in 2024 (still below trend) before rising to a 16.2 million pace in 2025.
- Higher mortgage rates continue to depress housing demand. Housing starts are expected to come in at 1.37 million in 2024 before rising to a 1.41 million pace in 2025 as mortgage rates ease next year.
- The unemployment rate is expected to move higher as the labor market rebalances averaging 4.1% in 2024 and 4.3% in 2025.
- Recent data shows that inflation is making progress toward the Fed’s 2% target. Growth in consumer prices is expected to slow a 2.9% pace in 2024 and 2.3% in 2025.
- With more signs that inflation is coming down and growing concerns that the labor market may be nearing an inflection point, hopes have risen that the Fed will start to cut rates in September. As a result, expectations for 10-year Treasury yields were slightly lower for 2024 and 2025.
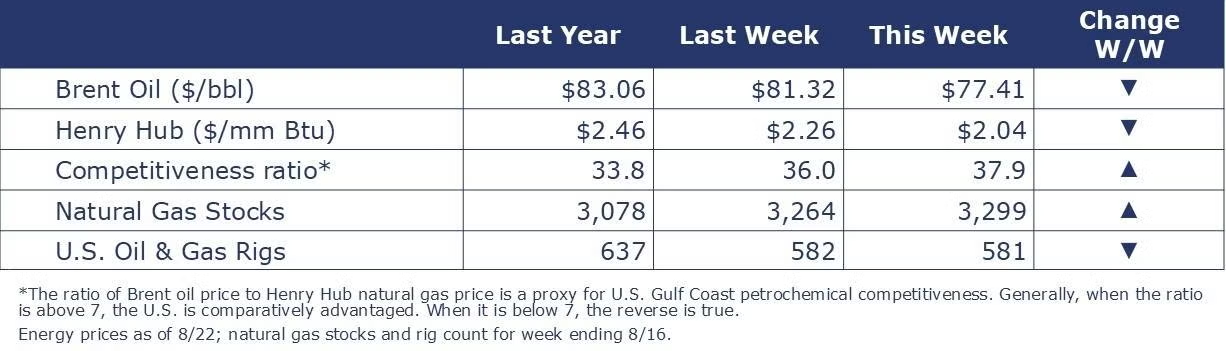
Oil prices were lower this week on renewed concerns about the US economy after revisions to BLS employment data suggested that job growth has been significantly weaker than initially estimated. In addition, expectations are growing for an interest rate cut in September. U.S. natural gas fell to just above $2/mmbtu on ample inventories going into the fall months. Following a rare mid-summer draw the previous week, natural gas inventories rose by 35 BCF during the week ending 17 August. The combined oil and gas rig count fell by 1 to 581.
Indicators for the business of chemistry suggest a yellow banner.
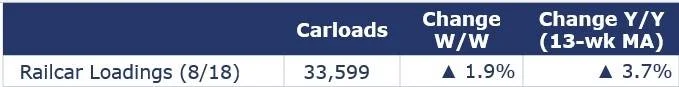
According to data released by the Association of American Railroads, chemical railcar loadings were up to 33,599 for the week ending 17 August. Loadings were up 3.7% Y/Y (13-week MA), up 4.4% YTD/YTD and have been on the rise for nine of the last 13 weeks.

