Running tab of macro indicators: 14 out of 20
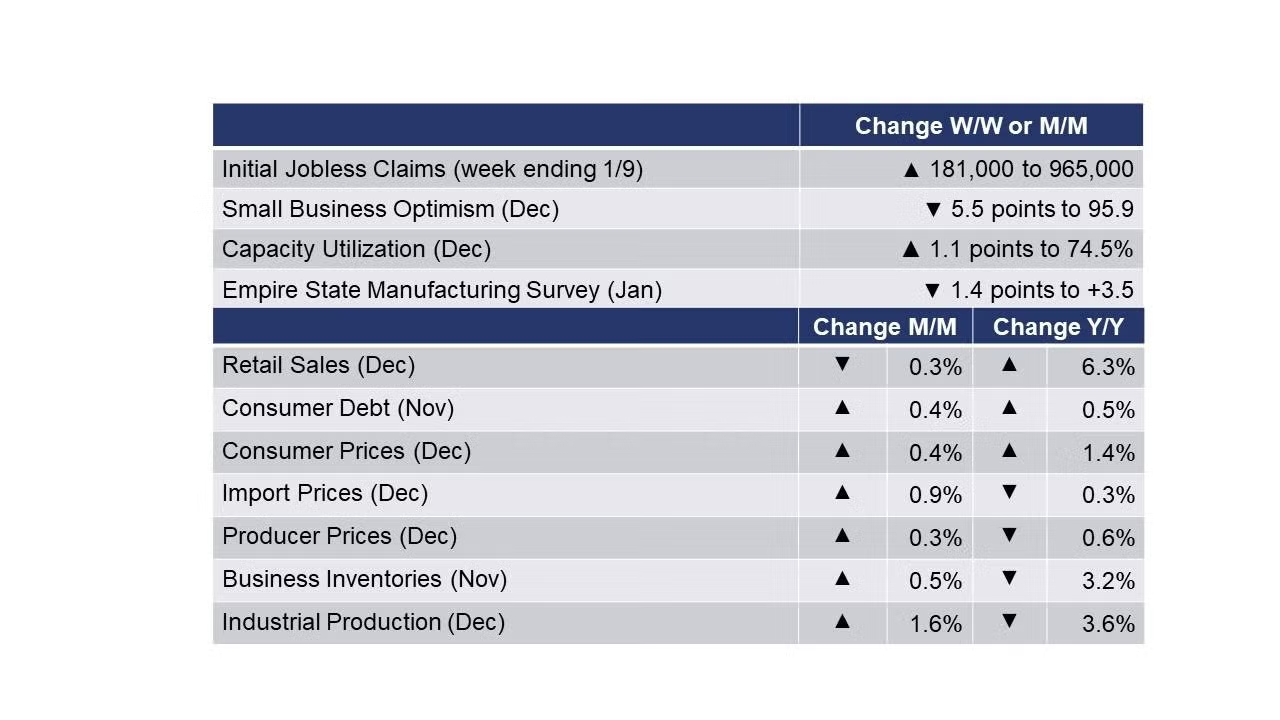
Led by lockdowns in California, the number of new jobless claims rose by 181,000 (the largest weekly gain since last March) to 965,000 during the week ending 9 January. Continuing claims rose by 199,000 to 5.27 million and the unemployment rate for the week ending 2 January rose 0.2 percentage points to 3.7%.
Non-mortgage consumer debt rose by 0.4% in November, the highest gain in five months. Credit card balances continued to decline while installment debt (i.e., car loans, student loans, etc.) accelerated. Compared to a year ago, debt balances were up 0.5%.
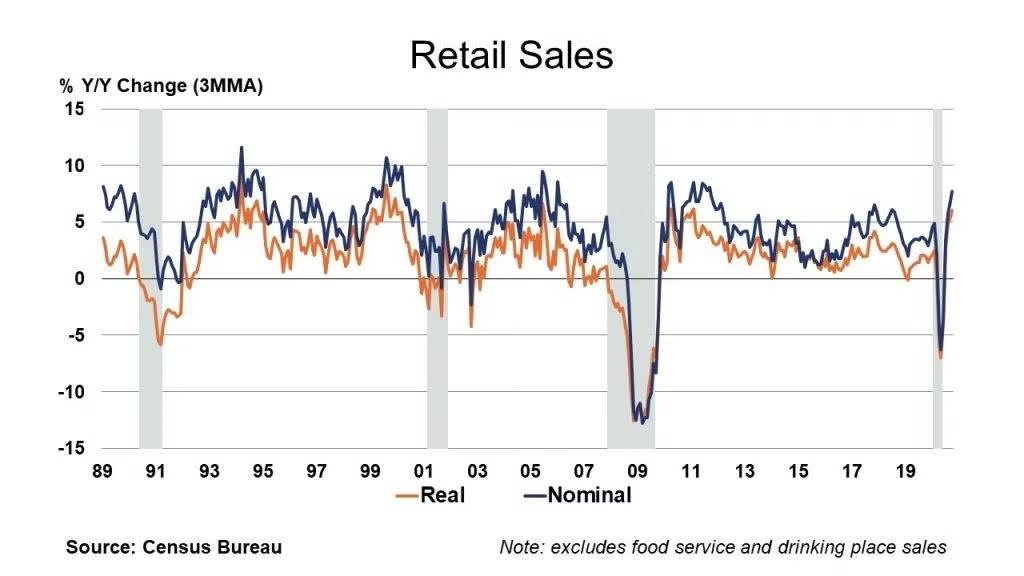
Amid rising COVID-19 cases, retail sales eased a disappointing 0.3% in December. Although there were gains in motor vehicles & parts dealers, building material and garden equipment & supplies, health & personal care stores, gasoline stations, apparel stores, and miscellaneous retailers, the other segments declined. In particular, furniture & home furnishing stores, department stores, and non-store retailers. Retail sales were up 6.3% Y/Y. At the same time, sales at food service and drinking places (a sector particularly affected by new lockdowns) fell 4.5% in December and were off 21.2% Y/Y.
Driven by gains in manufacturing and retail, business inventories rose 0.5% to $1.96 trillion at the end of November, a level off 3.2% Y/Y. The combined value of distributive trade sales and manufacturers’ shipments declined by 0.1% to $1.48 trillion, a level up 1.5% Y/Y. The monthly decline reflects a 1.1% drop in retail, a 0.7% gain for manufacturers, and a .2% gain for wholesalers. The inventory-to-sales ratio held steady at 1.32 in November. A year ago it was 1.39, indicating that supply imbalances are easing.
As expected, consumer prices rose 0.4% in December, led by gains in prices for energy, food, apparel, motor vehicle insurance, new vehicles, personal care, and household furnishings and operations. Excluding food and energy, core consumer prices rose 0.1%. Compared to a year ago, headline prices were up 1.4% while core prices were up 1.6% Y/Y. For 2020 as a whole, consumer prices were up 1.3% and core consumer prices rose 1.7%, the slowest annual gain since 2010. Producer prices increased 0.3% in December, and follows advances of 0.1% in November and 0.3% in October. Services prices eased but good prices, led by higher gasoline prices, rose 1.1%. Excluding food and energy, goods prices rose 0.5%. Prices for iron and steel, diesel fuel, jet fuel, meats, and home heating oil also moved higher. Producer prices were off 0.6% Y/Y. Import prices rose by a higher than expected 0.9% in December, the largest gain since August. As with consumer prices, the increase was led by higher prices for imported fuels. Excluding fuels, import prices rose by 0.4%. Compared to a year ago, import prices were still off by 0.3%.
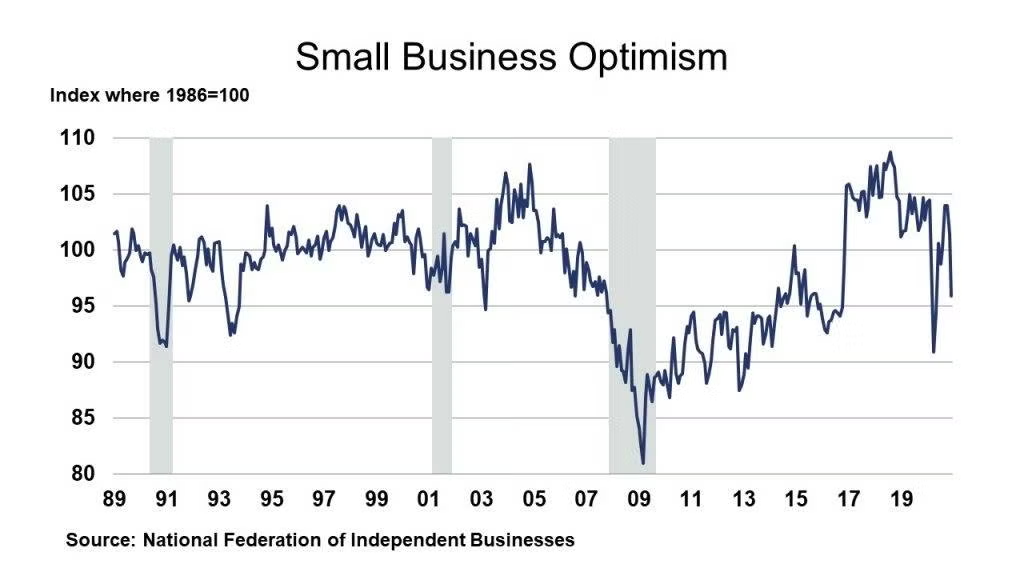
The NFIB reports that its index of small business optimism declined 5.5 points in December to 95.9, falling below the average (since 1973) index value. Nine of the 10 nndex components declined and only one improved. Owners expecting better business conditions over the next six months declined 24 points to a net negative 16%. Small businesses are concerned about potential new economic policy in the new administration and the increased spread of COVID-19 that is causing renewed government-mandated lockdowns.
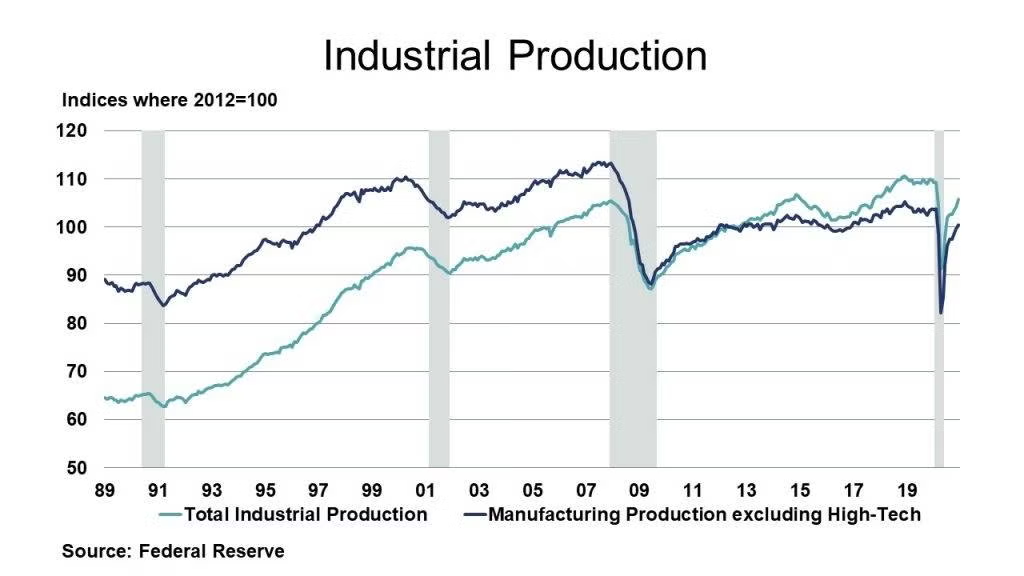
Industrial production rose 1.6%, triple expectations and with gains of 0.9% for manufacturing, 1.6% for mining, and 6.2% for utilities. The increase in the latter reflects a rebound in demand for heating after unseasonably warm weather in November. Within manufacturing, strong gains in primary metals, rubber & plastic products, and other sectors more than offset weakness in motor vehicles & parts. Overall industrial production was off 3.6% Y/Y and was 3.3% below pre-coronavirus levels. Capacity utilization rose 1.1 percentage points to 74.5%, a level 5.3 percentage points below the long-term average.
The Empire State Manufacturing Survey indicated that January business activity was little changed in New York State. The headline general business conditions index eased slightly (by 1.4 points) to +3.5. New orders and shipments edged higher, unfilled orders continued to move lower, and delivery times continued to lengthen somewhat. Employment levels increased modestly and the average workweek lengthened. Input price increases and selling price increases both picked up noticeably. Looking ahead, firms remained optimistic that conditions would improve over the next six months.
FEDERAL RESERVE BEIGE BOOK
The Beige Book is a compilation of reports on the regional economies in each of the 12 Federal Reserve districts. This version of the Beige Book reflects conditions through January 4th.
Most Federal Reserve Districts reported that economic activity increased modestly since the previous Beige Book period (through November 20th), although conditions remained varied: two Districts reported little or no change in activity, while two others noted a decline. Reports on consumer spending were mixed. Some Districts noted declines in retail sales and demand for leisure and hospitality services, largely owing to the recent surge in COVID-19 cases and stricter containment measures. Most Districts reported an intensification of the ongoing shift from in-person shopping to online sales during the holiday season. Auto sales weakened somewhat since the previous report, while activity in the energy sector was said to have expanded for the first time since the onset of the pandemic. Manufacturing activity continued to recover in almost all Districts, despite increasing reports of supply chain challenges. Residential real estate activity remained strong, but accounts of weak conditions in commercial real estate markets persisted. Banking contacts saw little or no change in loan volumes, with some anticipating stronger demand from borrowers in coming months for new government-backed lending programs. Although the prospect of COVID-19 vaccines has bolstered business optimism for 2021 growth, this has been tempered by concern over the recent virus resurgence and the implications for near-term business conditions.
The Dallas Fed reported that “…growth was widespread and led by nondurables, particularly petrochemical products. Petrochemical contacts noted healthy demand for PVC, driven by construction, and very strong plastic packaging demand.” Contacts in the Atlanta Fed District noted “…while many planned petrochemical processing expansion projects and liquefied natural gas export terminal construction projects remained stalled, some contacts reported renewed interest in moving projects forward.”
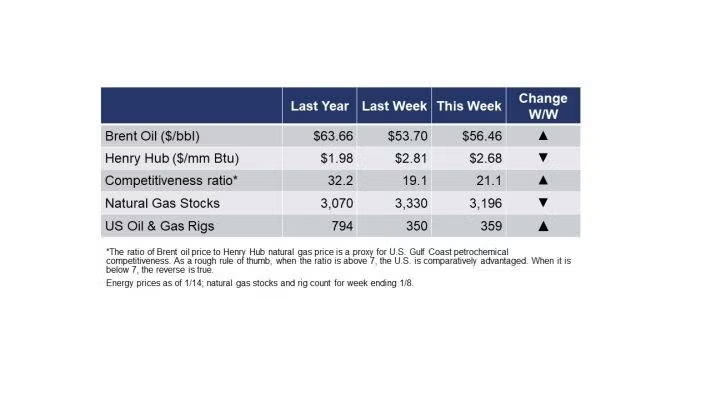
The rig count rose by nine to 359 rigs during the week ending 8 January. Saudi Arabia will cut oil production to support oil prices. Mild winter weather continues to hamper natural gas prices.
For the business of chemistry, the indicators still bring to mind a green banner for basic and specialty chemicals.
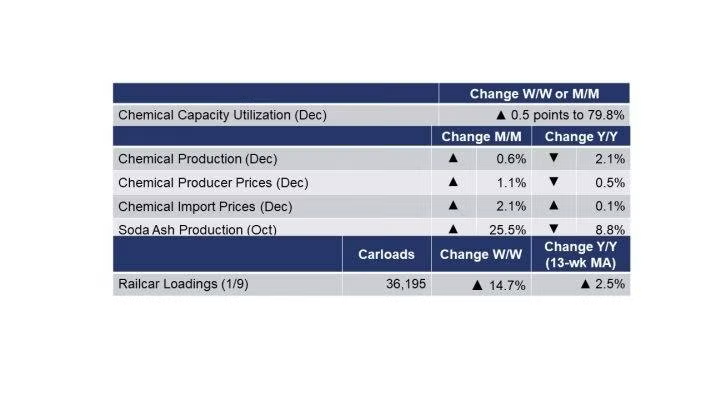
According to data released by the Association of American Railroads, chemical railcar loadings, the best ‘real time’ indicator of chemical industry activity, rose by 4,635 to 36,195 railcars the week ending 9 January (week 2). Loadings were up 7.2% Y/Y and the 13-week moving average, which is used to smooth out volatility, was up for the fifth week in a row, by 2.5%, the highest reading since early April 2020.
The U.S. Geological Survey reported that estimated monthly production of soda ash in October was 921 thousand tons, up 25.5% compared to the previous month and down 8.8% Y/Y. Stocks rose 29.9% M/M to 300 thousand tons at the end of the month, a 10-day supply. Ending stocks were down 8.8% Y/Y.
Chemical producer prices rose 1.1% in December, an acceleration from a 0.6% gain in November. Gains were widespread across segments with the only weakness reported in coatings. At the same time, feedstock prices jumped 9.6%. Compared to a year ago, producer prices were off 0.5% with feedstock prices up 15.3% Y/Y. Following a 0.5% gain in November, chemical import prices jumped 2.1% in December, the largest monthly gain in nearly a decade. Prices for chemical exports rose 1.7%, following another strong gain in November. Compared to a year ago, import prices were up 0.1% (after 22 months of negative Y/Y comparisons) and export prices were up 3.3% Y/Y.
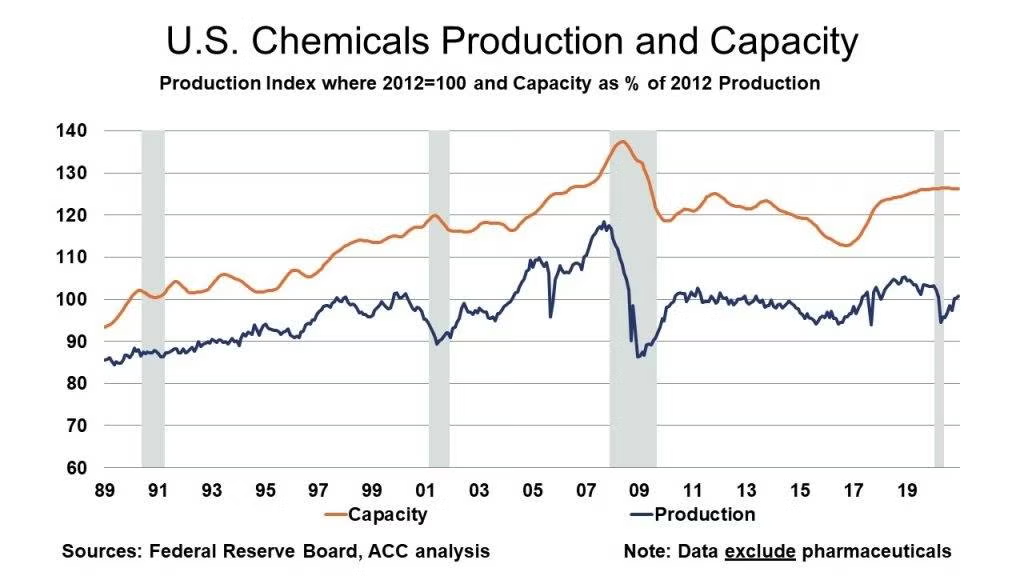
The Fed’s report on industrial production indicates that chemical production rose 0.6% in December and follows a 0.1% gain in November and a 2.9% gain in October. The latter reflected a rebound from the hurricanes in late summer/early fall. In December, production rose in specialty chemicals, agricultural chemicals, and consumer products but were off in basic chemicals, with weakness was widespread across segments. Within specialties, gains were widespread among coatings and other specialty chemicals. Production was off 2.1% Y/Y.
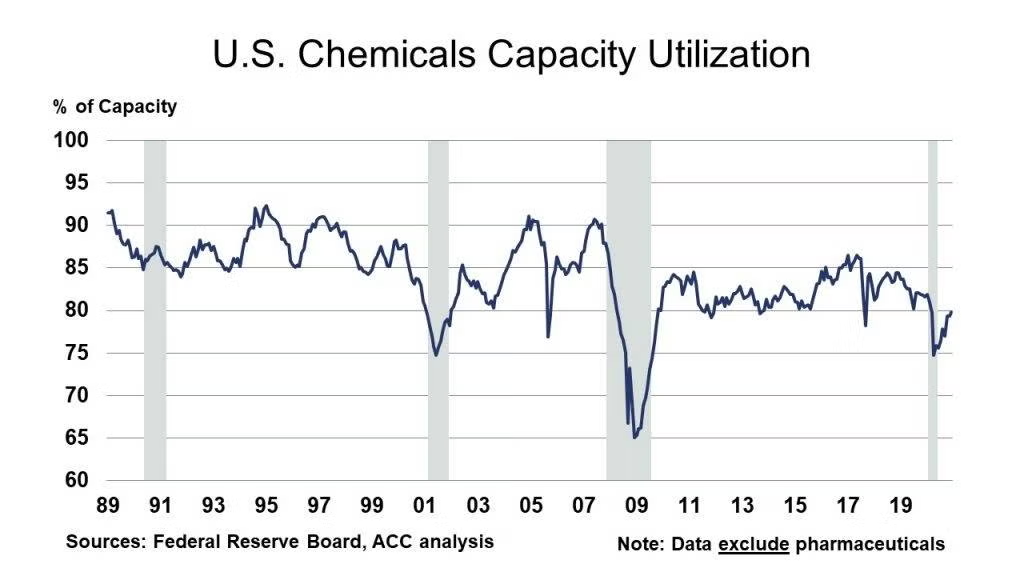
Chemical industry capacity was stable in December. With the headline gain in December production, chemical industry capacity utilization rose 0.5 percentage points to 79.8%.
Note On the Color Codes
The banner colors represent observations about the current conditions in the overall economy and the business chemistry. For the overall economy we keep a running tab of 20 indicators. The banner color for the macroeconomic section is determined as follows:
Green – 13 or more positives
Yellow – between 8 and 12 positives
Red – 7 or fewer positives
For the chemical industry there are fewer indicators available. As a result we rely upon judgment whether production in the industry (defined as chemicals excluding pharmaceuticals) has increased or decreased three consecutive months.
For More Information
ACC members can access additional data, economic analyses, presentations, outlooks, and weekly economic updates through MemberExchange.
In addition to this weekly report, ACC offers numerous other economic data that cover worldwide production, trade, shipments, inventories, price indices, energy, employment, investment, R&D, EH&S, financial performance measures, macroeconomic data, plus much more. To order, visit http://store.americanchemistry.com/.
Every effort has been made in the preparation of this weekly report to provide the best available information and analysis. However, neither the American Chemistry Council, nor any of its employees, agents or other assigns makes any warranty, expressed or implied, or assumes any liability or responsibility for any use, or the results of such use, of any information or data disclosed in this material.
Contact us at ACC_EconomicsDepartment@americanchemistry.com
Upcoming Events of Interest
“The Impact of the Presidential Elections on the Chemical Industry” Webinar
Edward Stones – Senior Business Director, Energy and Climate Change, The Dow Chemical Company and
Patrick Givens – Managing Director, Policy & Government Relations, Deloitte Securities
20 January (1:00 – 2:00 pm)
Société de Chimie Industrielle
www.societe.org
“The New US Administration – Where Are We Heading?” Virtual Discussion Group
4 February (4:00 – 5:00 pm)
Société de Chimie Industrielle
www.societe.org
ICIS World Base Oils & Lubricants Conference Live
16-18 February
ICIS (virtual)
ICISEVENTS

