MACROECONOMY & END-USE MARKETS
Running tab of macro indicators: 10 out of 20
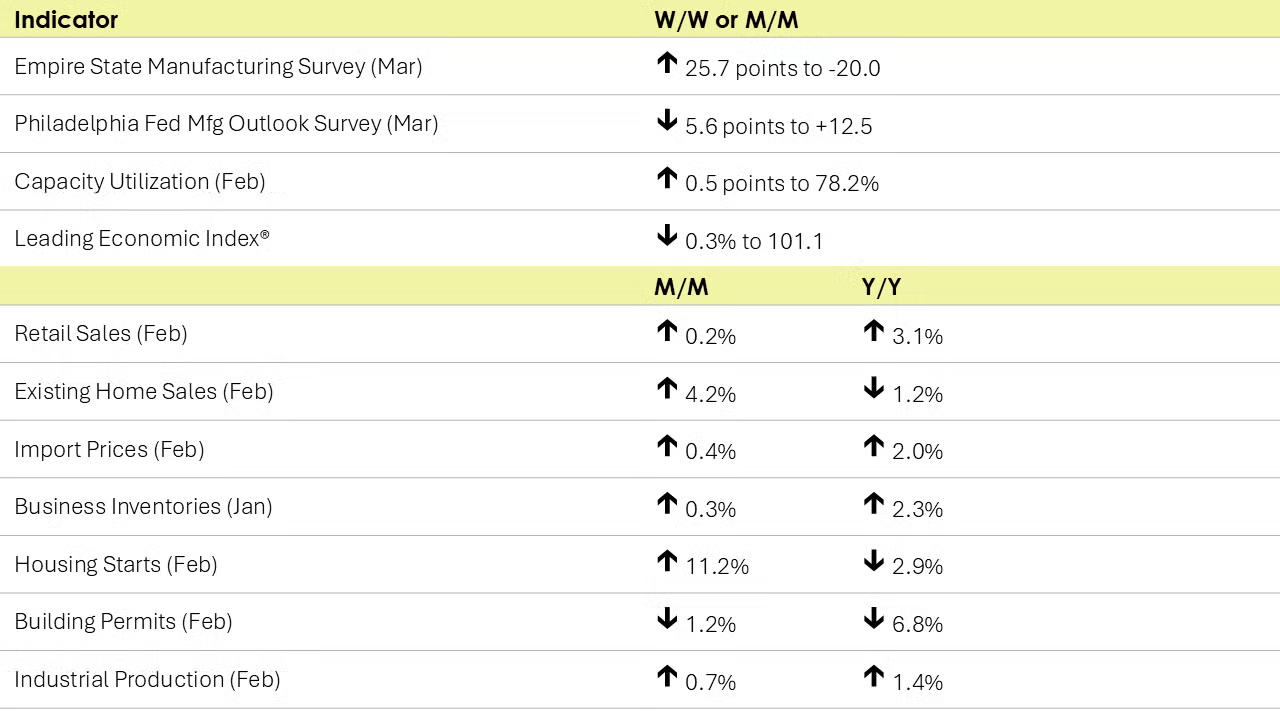
Following a 1.2% decline in January that partially reflected the impact of winter storms, retail and food service sales rose by a modest 0.2% in February, suggesting consumers may be starting to pull back. Sales were mixed. There were higher sales at health & personal care stores, food & beverage stores, general merchandise stores, building material & garden centers, and online platforms. Those sales were partially offset by lower sales at bars & restaurants, motor vehicle & parts dealers, electronics & appliance stores, gas stations, clothing & accessory stores, sporting goods & hobby stores. Compared to a year ago, retail sales were still up 3.1% Y/Y.
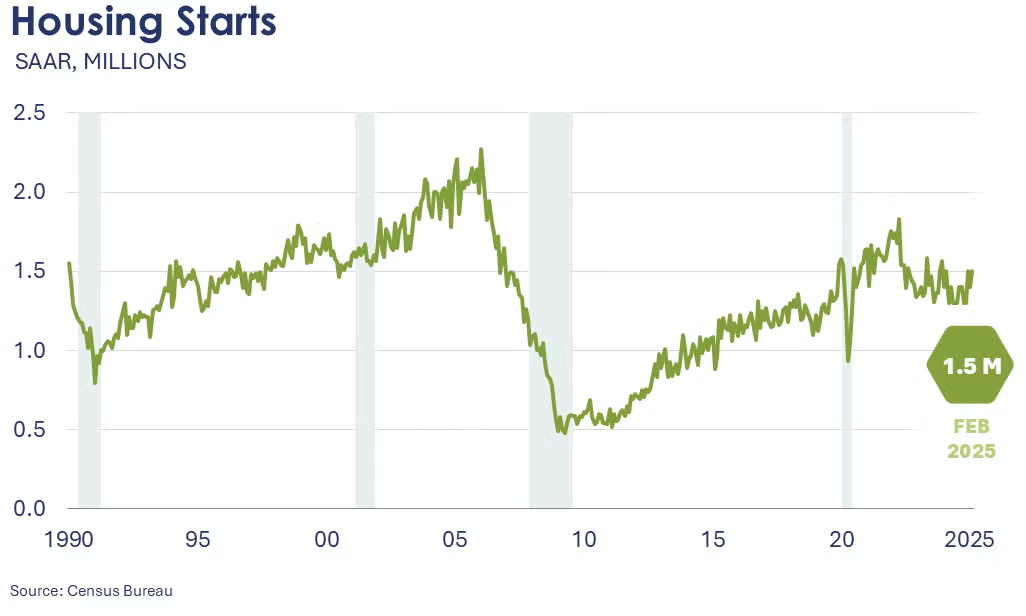
After tumbling in January due to winter storms, housing activity rebounded in February with housing starts up a robust 11.2%. The gain was driven by an 11.4% gain in chemistry-intensive single-family starts. There were gains across all regions, except the Midwest. Forward-looking building permits eased however, down 1.2%. Compared to a year ago, housing starts were down 2.9%, while building permits were down 6.8% Y/Y.
Separately, homebuilder confidence hit a 7-month low in March on growing uncertainty about how building costs will be impacted by tariffs.
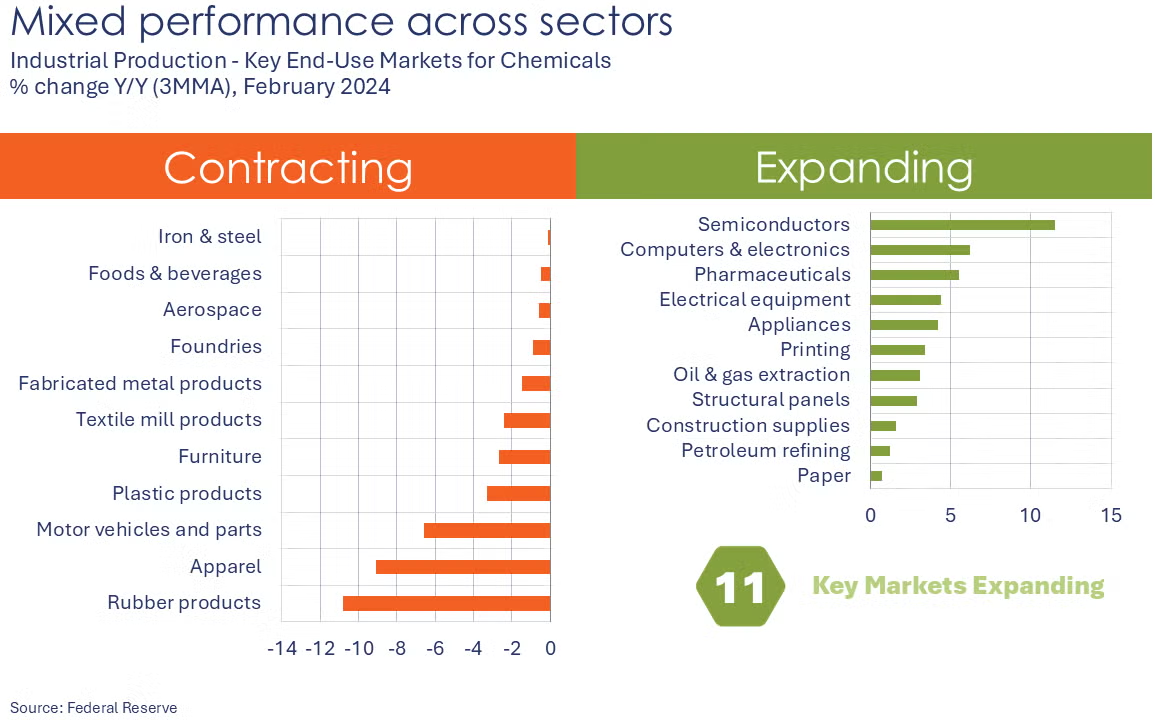
Industrial production rose by 0.7% in February following a 0.3% gain in January. Utility output fell back, but mining and manufacturing production rose. Within manufacturing, there were robust gains in the output of motor vehicles and parts, electrical equipment, wood products, aerospace, apparel, and chemicals & pharmaceuticals. Several industries saw lower output, however, including furniture, food & beverage, primary metals, and petroleum products. Compared to a year ago, industrial production was up 1.4% Y/Y. Capacity utilization tightened, up 0.5 points to 78.2%, slightly higher than 78.1% a year ago.
An early look into March, manufacturing activity continued to expand at a slower pace in the Philadelphia region, but deteriorated in New York State. The headline index of the Philadelphia Fed’s Manufacturing Business Outlook Survey fell 5.6 points to +12.5. A reading above zero indicates expansion.
The NY Fed’s Empire State Manufacturing Survey general business conditions index fell 25.7 points to -20.0, indicating contraction in manufacturing activity in the region. In both surveys, input prices were noted to have risen sharply and optimism about future business conditions waned.
Existing home sales unexpectedly rose in February, up 4.2% to a 4.26 million pace. In addition to lower mortgage rates and higher supply, the acceleration likely reflects some rebound from January’s winter storms and wildfires that may have dampened homebuying activity. The inventory of unsold homes climbed 5.1% from the prior month (up 17.0% from a year ago) and was equivalent to a 3.5-month supply at the current sales pace. The median sales price rose 3.8% Y/Y to $398,400, the 20th consecutive month of year-over-year price increases.
The Conference Board’s Leading Economic Index® (LEI) continued to slide in February, down 0.3% to 101.1. Over the past six months, the LEI was off 1.0%, which was less than half of the rate of decline over the previous six months (-2.1%). Half of the 10 subcomponents fell in February with a sharp deterioration in consumer expectations being the largest negative contributor.
Combined business inventories rose 0.3% in January, following a decline in December. The gain was driven almost entirely by higher wholesale inventories. Manufacturers inventories edged slightly higher and retail inventories were flat. Business sales, however, fell 0.8% with notable declines in wholesale and retail sales that were only partially offset by higher manufacturers’ sales. Compared to a year ago, business inventories were up 2.3% Y/Y while sales were up 3.5% Y/Y. The inventories-to-sales ratio moved higher, from 1.30 in December to 1.32 in January.
Import prices rose 0.4% for a second consecutive month in February. Higher prices for imported fuels, nonfuel industrial supplies & materials and consumer goods more than offset lower prices for capital goods. Export prices were also slightly higher, up by 0.1% with gains in agricultural export prices offset by smaller gains in other segments. Compared to a year ago, import prices were up 2.0% Y/Y while export prices were up 2.1% Y/Y.
Survey of Economic Forecasters
Coming into the end of Q1, the outlook for the U.S. economy is unusually uncertain. Expectations for 2025 and 2026 have weakened across a number of indicators.
- U.S. GDP is expected to grow by 2.1% in 2025 and by 2.0% in 2026.
- Growth in consumer spending is expected to moderate to a 2.5% pace in 2025 before easing further to a 2.0% gain in 2026.
- Business investment growth is expected to slow to 2.1% in 2025 before rising to 2.8% in 2026.
- Following a 0.3% decline in 2024, we look for industrial production to expand by 1.1% in 2025 and 1.6% in 2026. Growth is uneven among industries, however.
- Sales of autos and light trucks rose to 15.8 million in 2024 (still below trend). In 2025, vehicle sales are expected to rise to a 16.0 million pace and rise further to 16.2 million in 2026, the same as last month’s survey.
- Housing starts fell to 1.37 million in 2024 and are expected to be essentially flat in 2025 as pressure remains on the 10-year Treasury which is tied to mortgage rates. A slight improvement is expected in 2026 with housing starts rising to 1.40 million.
- The unemployment rate is expected to move slightly higher as the labor market continues to rebalance, averaging 4.2% in 2025 and 4.3% in 2026.
- Recent data continues to show slowing progress on inflation. In 2024, growth in the CPI slowed to 2.9%. Growth in consumer prices is expected to remain steady in 2025 at a 2.9% pace before easing to a 2.6% pace in 2026.
- The Fed has signaled “higher for longer”. The 10-year Treasury is expected to peak in 2025 before easing in 2026.
Globally, expectations also deteriorated compared to those published at the end of last year.
- Global GDP growth expectations eased to 2.7% for 2025. The 2026 global growth forecast was also downwardly revised to 2.7%.
- Global inflation pressures have eased since 2022 but remain elevated. Inflation will continue to moderate, advancing at a 3.7% pace in 2025 and further easing to a 3.4% pace in 2026.
- Global manufacturing remained relatively weak in 2024 but is expected to firm slightly in the years ahead. Global industrial production is expected to grow 2.1% in 2025 and 3.0% in 2026, but both have been downwardly revised.
- Following a modest recovery in 2024, world trade volumes are expected to continue to grow over the next few years, but at a slower pace than projected last November. World trade volumes are expected to expand by 2.9% in 2025 and 2.6% in 2026.
The Survey of Economic Forecasters data are available to ACC members on ACC Exchange.
ENERGY
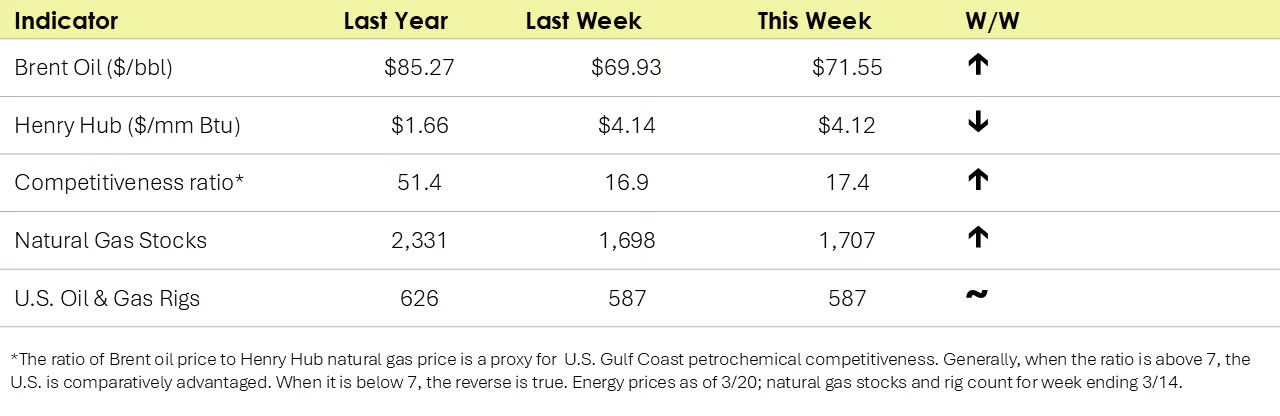
- Oil prices settled higher as the U.S. launched airstrikes against Houthi rebels and vowed to maintain pressure as the US seeks to end Houthi-led disruptions in the Red Sea.
- U.S. natural gas prices remained above $4/mmbtu as new forecasts call for cooler weather over the next several weeks.
- Last week’s burst of warmer weather allowed natural gas inventories to post their first build of the season, up by 9 BCF. Inventories are 10% below the five-year average, however, in contrast to earlier in the heating season when inventories were at the top of the historic range.
- The combined oil & gas rig count remained stable at 587.
CHEMICALS
Indicators for the business of chemistry suggest a yellow banner.

According to data released by the Association of American Railroads, chemical railcar loadings were up slightly to 33,132 for the week ending March 15th. Loadings were up 0.2% Y/Y (13-week MA), up 1.9% YTD/YTD and have been on the rise for eight of the last 13 weeks.
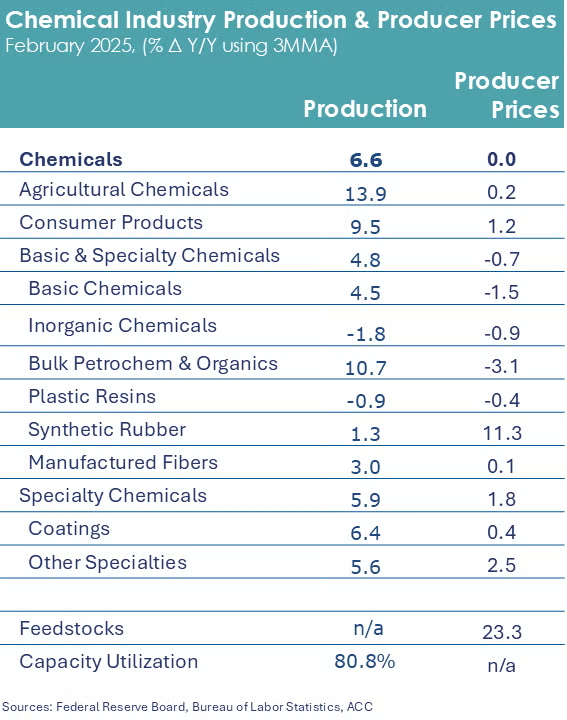
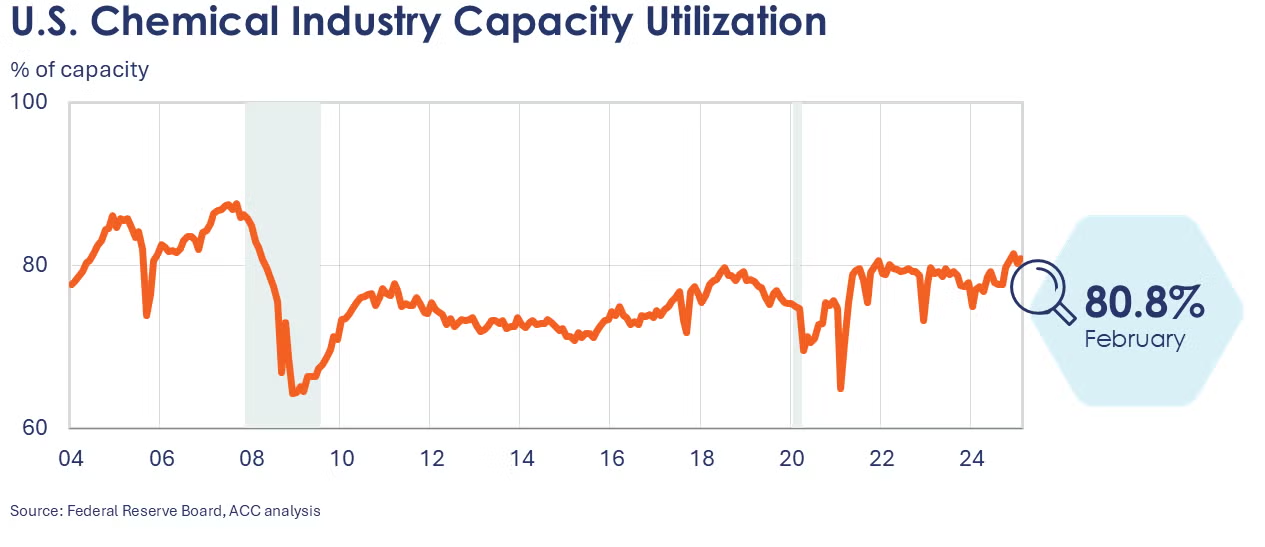
Following disruptions related to winter storm Enzo in January, chemical production rose 0.8% in February. Gains were broad-based with higher output in organic chemicals, inorganic chemicals, plastic resins, synthetic rubber, manufactured fibers, coatings and consumer products. Output of fertilizers and other specialty chemicals was lower and crop protection chemical production was flat. Compared to a year ago, chemical output was 5.9% higher. Chemical capacity utilization tightened to 80.8%, up from 77.1% last February.
Chemical import prices rose 0.8% in February, the largest monthly gain in nearly three years. Chemical export prices also edged slightly higher. Compared to a year ago, chemical import prices remained off, down by 0.4% Y/Y, while export prices were 3.1% higher than February 2024.
Note On the Color Codes
Banner colors reflect an assessment of the current conditions in the overall economy and the business chemistry of chemistry. For the overall economy we keep a running tab of 20 indicators. The banner color for the macroeconomic section is determined as follows:
- Green – 13 or more positives
- Yellow – between 8 and 12 positives
- Red – 7 or fewer positives
There are fewer indicators available for the chemical industry. Our assessment on banner color largely relies upon how chemical industry production has changed over the most recent three months.
For More Information
ACC members can access additional data, analyses, and presentations through ACCExchange.
Non-members may purchase select economic and industry data through the ACC Store.
Every effort has been made in the preparation of this weekly report to provide the best available information and analysis. However, neither the American Chemistry Council, nor any of its employees, agents or other assigns makes any warranty, expressed or implied, or assumes any liability or responsibility for any use, or the results of such use, of any information or data disclosed in this material.
Questions? Send us an email.