MACROECONOMY & END-USE MARKETS
Running tab of macro indicators: 12 out of 20
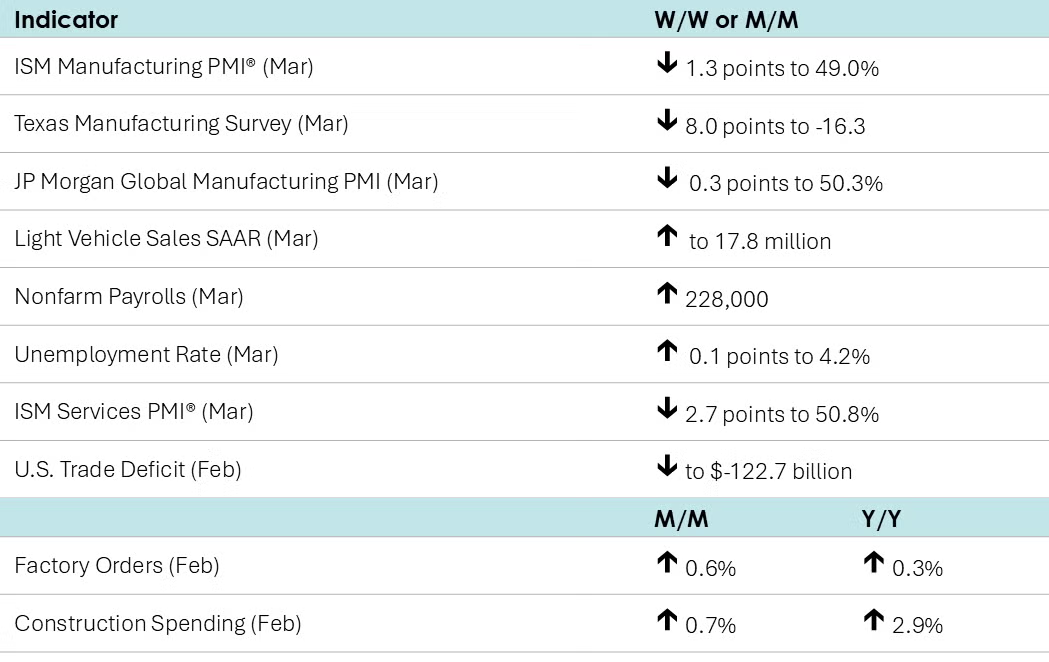
Nonfarm payrolls rose by a better-than-expected 228,000 in March, up from the 117,000 jobs added in February. Payrolls expanded across most sectors of the economy last month. Federal government employment continued to decline, but was offset by gains in other sectors. Manufacturing employment edged higher by 1,000. Average hourly earnings of all workers rose 3.8% Y/Y, the slowest pace since last July. The unemployment rate ticked higher to 4.2% as net new entrants into the labor force were not fully absorbed into employment. The participation rate edged higher to 62.5%.
Job openings eased in February. The quits rate (a sign of workers’ willingness to voluntarily leave a job) remained stable, as did the layoff rate. There was a spike in layoffs of Federal workers as DOGE cuts were just beginning, but there was little impact on the broader labor market.
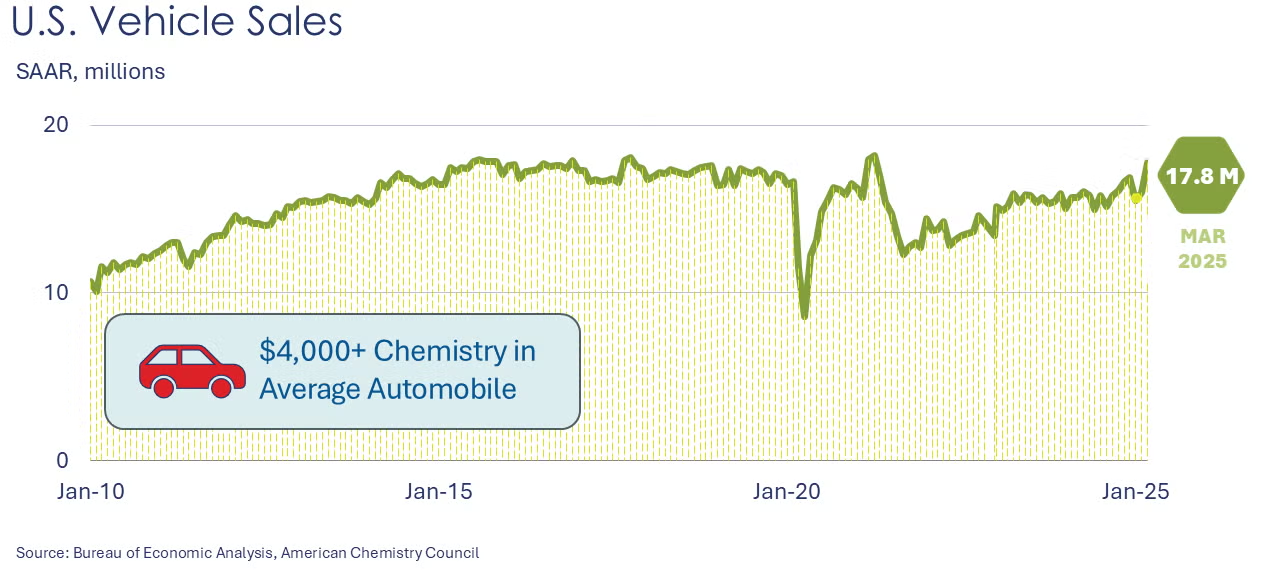
Light vehicle sales surged in March, up to a 17.8 million seasonally adjusted annual rate (SAAR), the highest pace in nearly four years. Sales were sharply higher for both passenger automobiles and light trucks (including SUVs and minivans). Light truck sales hit a new record both in level terms (14.6 million SAAR) and as a share of total light vehicle sales (82%). Sales of vehicles may have been pulled forward as tariff threats motivated buyers in March, according to auto dealers.
The ISM Manufacturing PMI® fell 1.3 points to 49.0% in March, signaling that manufacturing activity contracted following slight expansions in January and February. Nine industries expanded while seven (including chemicals) contracted. New orders and backlogs contracted, as did production and employment. Imports expanded while export orders contracted. Supplier deliveries were slower, likely reflecting accelerated delivery requests from customers in advance of tariff actions. Raw materials inventories expanded at a slower pace.
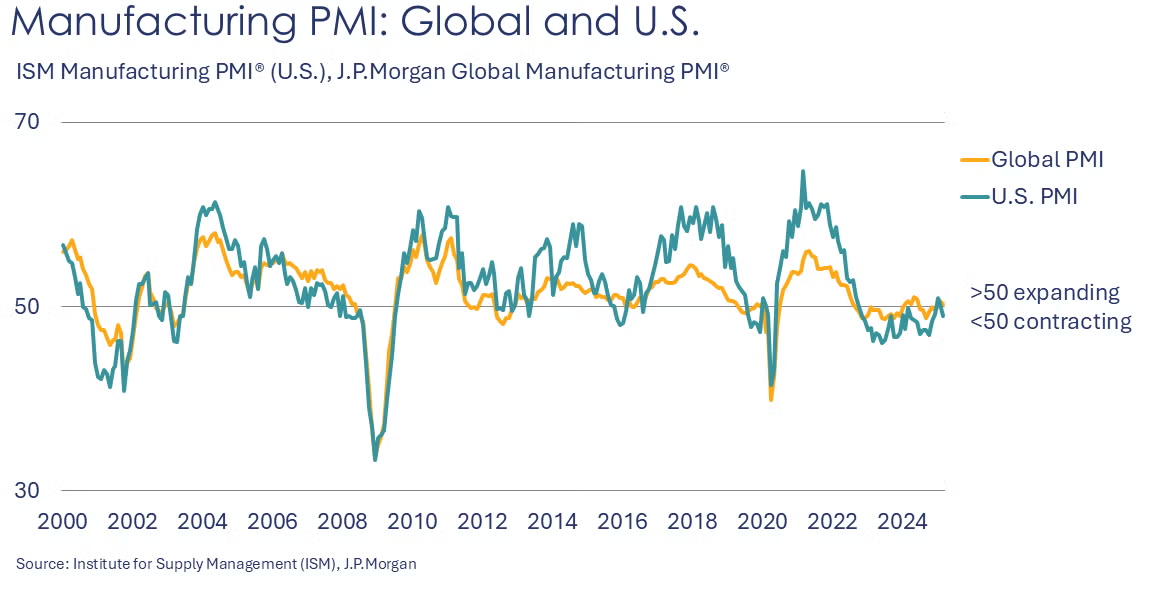
Looking abroad, the JP Morgan Global Manufacturing PMI eased by 0.3 points to 50.3. Global manufacturing output increased for a third consecutive month, though with the weakest rate of growth over that time. New orders and export orders also grew at a slower pace. Deepening downturns were seen in Japan and the UK, but there was better news from the euro area and Asia (excluding Japan). Production in China hit a four-month high while expansions were also seen in India, Vietnam, Thailand and Taiwan.
Manufacturing activity in Texas continued to deteriorate in March according to the Dallas Fed’s Texas Manufacturing Outlook Survey. The general business activity index fell 8.0 points to -16.3, a 10-month low. Production rebounded slightly, but capacity utilization, orders, unfilled orders, and hours worked slipped. Among the comments, several respondents noted the uncertainty around tariffs and the concern about sudden cost increases to their businesses.
Factory orders rose 0.6% in February, following a 1.8% gain in January. Orders were higher for motor vehicles & parts, consumer durables, computers & related products, information technology, construction materials and consumer nondurables. Orders were lower for both civilian and defense capital goods. Core business orders (nondefense capital goods excluding aircraft) were down 0.2% following a 1.0% gain in January. Unfilled orders (a measure of the manufacturing pipeline) ticked higher (up 0.1%). Manufacturers’ shipments accelerated, up 0.7%, with broad gains across major segments. Inventories edged slightly higher, up by 0.1%. The largest gains in inventories were in motor vehicles & parts, consumer durable goods, and defense equipment. As shipments grew faster than inventories, the inventories-to-shipments ratio fell from 1.46 in January to 1.45 in February. A year ago, the ratio was 1.47.
Construction spending rebounded in February, up by 0.7% (and up 2.9% Y/Y). On the privately funded side, there was higher spending on new-single family projects, office (driven by data centers), commercial, transportation, manufacturing, and power, among other categories. Publicly funded construction spending continued to rise and was up strongly from a year ago, suggesting that some of the Infrastructure Investment and Jobs Act (IIJA) funding is hitting the ground.
In anticipation of rising U.S. tariffs and potential retaliation against U.S. exporters, U.S. exports of goods and services surged 2.9% in February to a record $278 billion. Imports were essentially unchanged from January’s record high of $401 billion. As a result, the trade deficit narrowed to $123 billion. Both imports and exports of capital goods topped new records. Consumer goods imports also set a new record high.
The ISM Services PMI® fell 2.7 points to 50.8%, suggesting that the broader services sector continued to expand in March, but at a slower pace. Business activity accelerated, but new orders grew at a slower pace. Employment, new export orders, and order backlogs contracted. Imports rose.
ENERGY
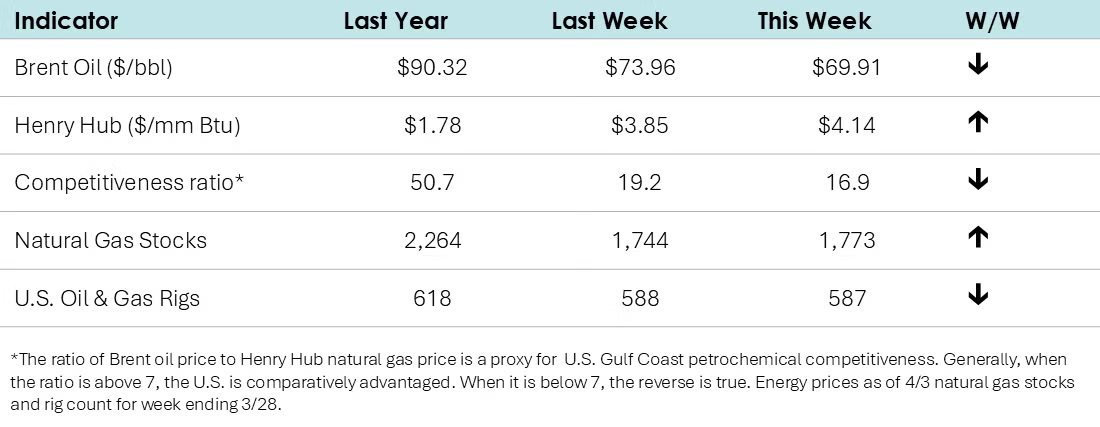
- Oil prices slid lower on concerns of a global economic slowdown. In addition, eight key OPEC+ producers agreed to increase oil production starting next month.
- Natural gas prices rebounded back above $4/mmbtu (despite a third consecutive week of higher inventories) on a colder forecast for April.
- The combined oil & gas rig count eased by one to 587. The rig count has remained essentially stable for the past six weeks.
CHEMICALS
Indicators for the business of chemistry suggest a yellow banner.
Within the details of the ISM Manufacturing PMI® report, the chemical industry was one of seven industries reporting contraction. New orders, export orders, production, order backlogs, imports and employment reportedly declined for chemical producers. Supplier deliveries were slower and customer inventories were deemed “too low.” Among the comments, one respondent from the chemical products sector noted, “Complex markets saw a surge in volume buying in anticipation of 2025 being slightly better than 2024. In March, however, all markets saw a slowdown, with fear and inventory stocking to hold through a potential crisis.”
Among the comments from the Texas Manufacturing Outlook Survey, one chemical manufacturing respondent noted “The tariff discussion is driving significant uncertainty and a negative outlook. Project costs are increasing immediately, with significant rises in equipment and piping costs.”
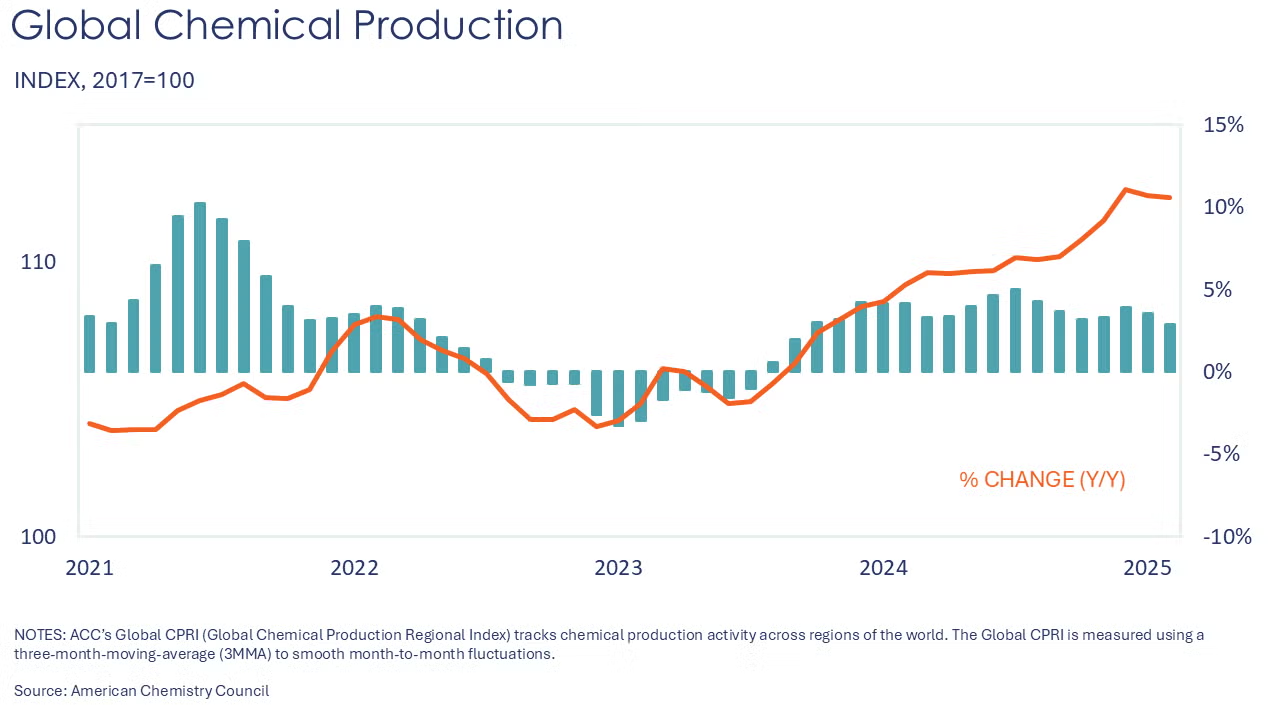
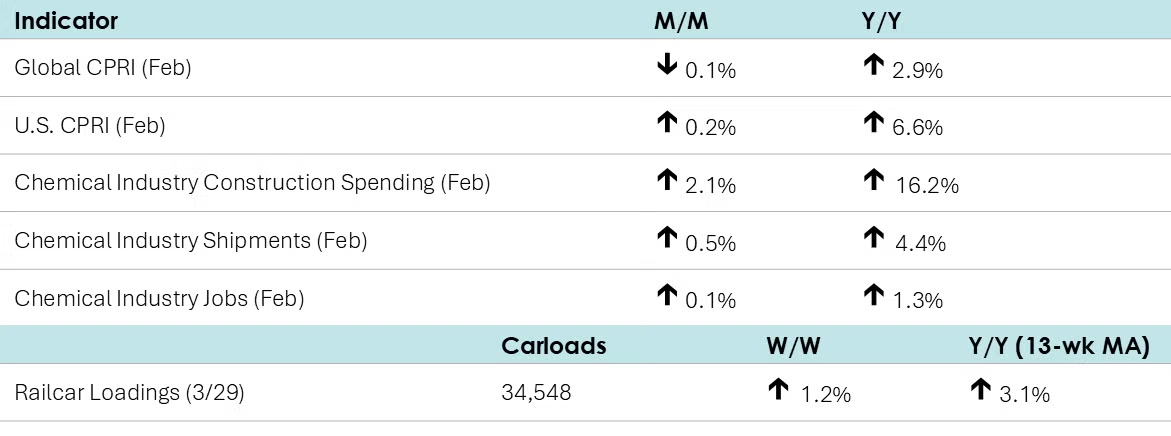
The ACC’s Global Chemical Production Regional Index (Global CPRI) declined by 0.1% in February 2025. The Asia-Pacific region led the decline as China and many countries in the region celebrated the Lunar New Year. European production improved, but a weak manufacturing sector may dampen production in the coming months. In South America, production continued to slow this month; however, Y/Y growth remained positive as economic conditions continued to improve in the region. Overall, all segments declined, but production rose by 2.9% Y/Y.
The U.S. CPRI increased by 0.2% in February. This index measures chemical production trends based on a three-month moving average to smooth out month-to-month volatility. Production rose in most regions of the country except Gulf Coast, where a snowstorm in late January shut down production. Overall, the U.S. CPRI is 6.6% higher than it was a year ago. See ACC’s new CPRI dashboard for more data and interactive charts.
According to data released by the Association of American Railroads, chemical railcar loadings were up to 34,548 for the week ending 29 March. Loadings were up 3.1% Y/Y (13-week MA), up (2.0%) YTD/YTD and have been on the rise for nine of the last 13 weeks.

Chemical shipments rose for a fifth consecutive month in February, up 0.5% to $55.1 billion. There were gains in the shipment of coatings, adhesives, and other chemicals. Shipments of agricultural chemicals were lower. Chemical inventories expanded slightly, up by 0.1%. Compared to a year ago, inventories were up 0.7% Y/Y while shipments were up 4.4% Y/Y. The inventories-to-shipments ratio for chemicals eased from 1.17 in January to 1.16 in February. A year ago, the ratio was 1.21.
Chemical industry jobs rose 0.1% in February to 549,300, a level up 1.3% Y/Y. Employment in plastic resin manufacturing also rose, up 0.2% to 61,400, a level 0.8% higher than last February. (Note that data at the detailed industry level are lagged one month behind the headline jobs report.)
In March, combined chemical and pharmaceutical jobs rose by 900 to 902,100, a level up 0.6% Y/Y. A gain in the number of production workers more than offset a small decline in supervisory & non-production workers. Average hourly wages rose at a 3.8% Y/Y rate. The average workweek edged higher from 41.7 hours to 41.8 hours in March.
Chemical industry construction spending rose 2.1% in February to $41.5 billion, a level up 16.2% Y/Y.
Note On the Color Codes
Banner colors reflect an assessment of the current conditions in the overall economy and the business chemistry of chemistry. For the overall economy we keep a running tab of 20 indicators. The banner color for the macroeconomic section is determined as follows:
Green – 13 or more positives
Yellow – between 8 and 12 positives
Red – 7 or fewer positives
There are fewer indicators available for the chemical industry. Our assessment on banner color largely relies upon how chemical industry production has changed over the most recent three months.
For More Information
ACC members can access additional data, economic analyses, presentations, outlooks, and weekly economic updates through ACCexchange.
In addition to this weekly report, ACC offers numerous other economic data that cover worldwide production, trade, shipments, inventories, price indices, energy, employment, investment, R&D, EH&S, financial performance measures, macroeconomic data, plus much more. To order, visit the ACC Store.
Every effort has been made in the preparation of this weekly report to provide the best available information and analysis. However, neither the American Chemistry Council, nor any of its employees, agents or other assigns makes any warranty, expressed or implied, or assumes any liability or responsibility for any use, or the results of such use, of any information or data disclosed in this material.
Questions? Contact us via email.