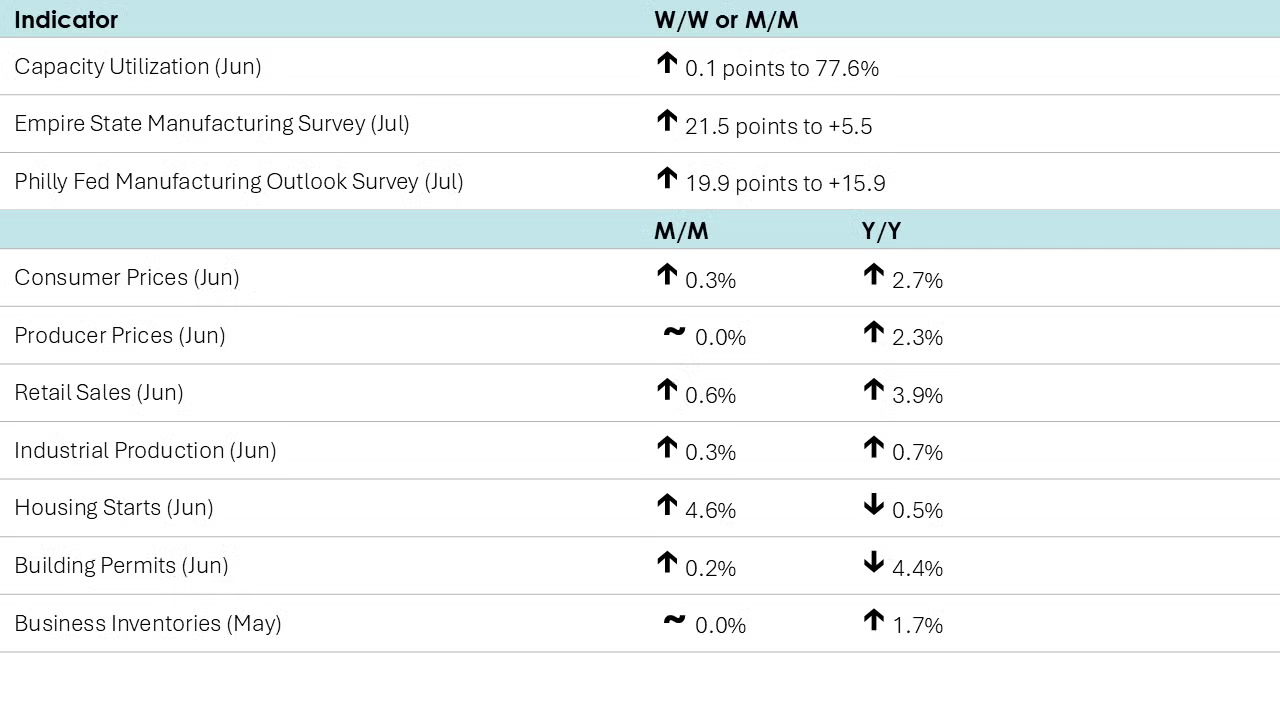
Consumer prices rose 0.3% in June, following a 0.1% uptick in May. The June increase was the highest since January. Price increases in shelter, energy, and food propelled the overall monthly rise. Excluding food and energy, core prices leaped 0.2% in June. Compared to a year ago, headline consumer prices increased by 2.7% Y/Y, higher than the 2.4% Y/Y rise witnessed in May and the highest Y/Y change since March. Meanwhile, core consumer prices advanced 2.9% Y/Y in June, up from a 2.8% Y/Y increase in May.
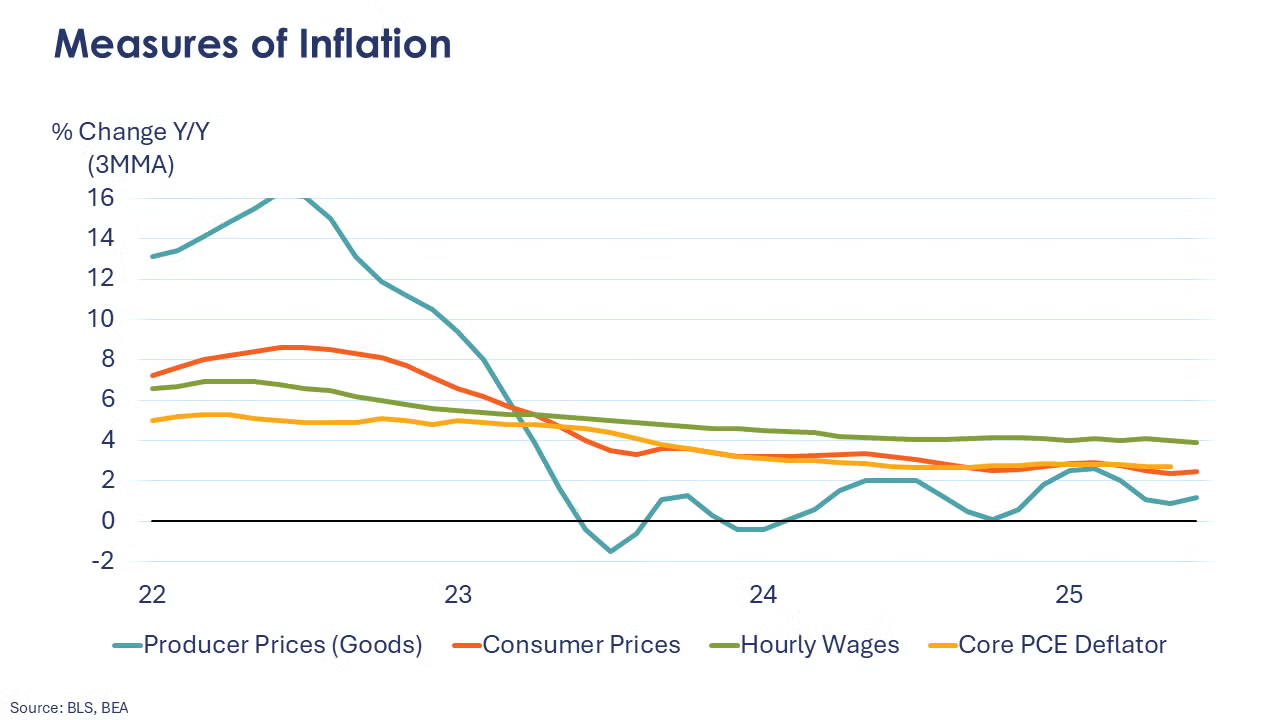
Producer prices were flat in June after rising 0.3% in May, with declines in prices for final demand services prices offsetting increases in final demand goods prices. Compared to a year ago, headline producer prices were up 2.3% Y/Y, decelerating from May’s 2.7% Y/Y gain. Prices for final demand goods rose 1.7% Y/Y after advancing 1.1% Y/Y in May. At the same time, prices for final demand services eased to 2.7% Y/Y in June, down from the most recent peak of 4.5% Y/Y this past January.
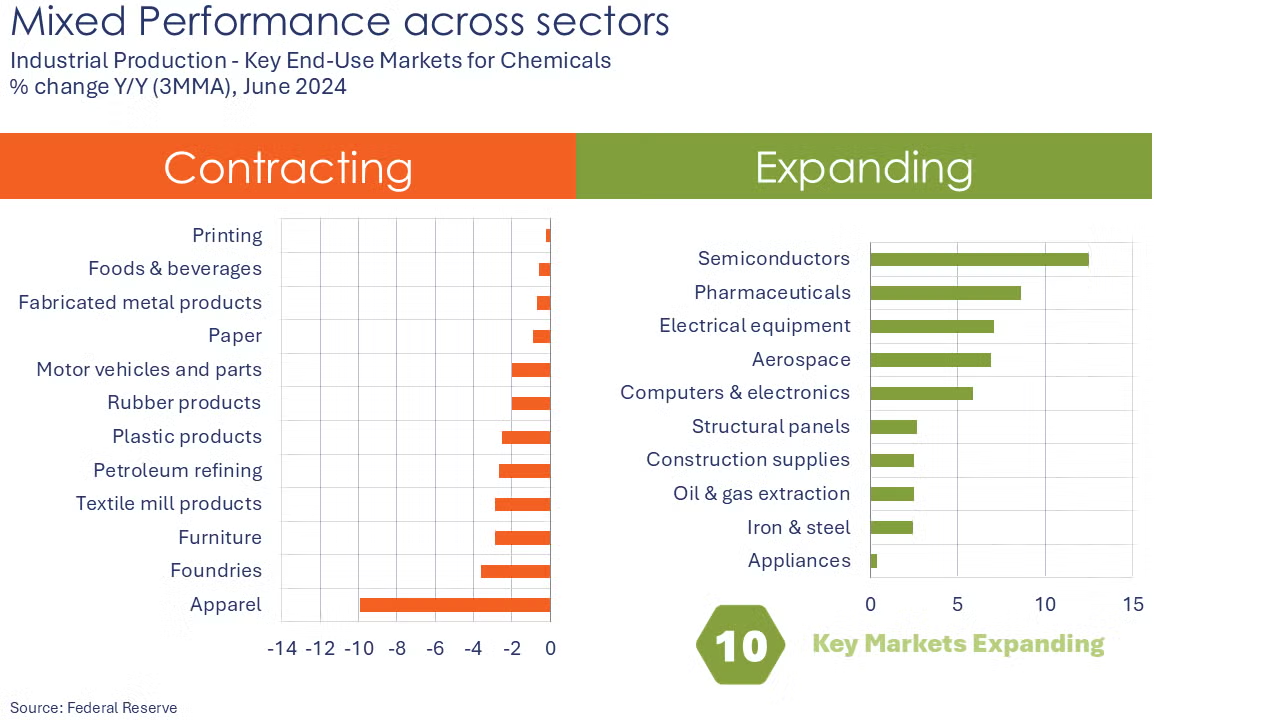
Industrial production expanded by 0.3% in June following two consecutive months of flat growth. Mining output declined, but utility and manufacturing output rose. Manufacturing production edged higher by 0.1% following a 0.3% gain in May. The largest monthly percentage gains were in primary metals, aerospace, furniture, and petroleum products. The largest declines were in electrical equipment, motor vehicles, and textiles. Capacity utilization ticked higher to 77.6%, still below last year’s 78.2% and its long-term average of 79.6%.
Two regional Fed manufacturing surveys offered a first look at manufacturing conditions in July. According to the Empire State Manufacturing Survey, manufacturing activity picked up slightly New York State with small expansions in new orders and shipments. Manufacturing activity also expanded in the Philadelphia region with further growth in new orders and shipments. Firms in both regions continued to be optimistic about business conditions six months ahead.
Combined business inventories were flat for a second consecutive month in May as gains in retail and manufacturing inventories offset a decline in wholesale inventories. Combined business sales continued to move lower, down 0.4% with a drop in retail and wholesale offsetting a small increase in manufacturing sales. The inventories-to-sales ratio ticked slightly higher to 1.39. A year ago, the ratio was 1.41.
Fed Beige Book
Published two weeks in advance of each FOMC (Federal Open Market Committee) meeting, the Beige Book presents a summary of recent economic conditions around the twelve Federal Reserve Districts.
- Economic activity increased slightly from late May through early July. Five Districts reported slight or modest gains, five had flat activity, and the remaining two Districts noted modest declines in activity.
- Uncertainty remained elevated, contributing to ongoing caution by businesses. Consumer
- Auto sales receded modestly on average, after consumers had rushed to buy vehicles earlier this year to avoid tariffs.
- Manufacturing activity edged lower.
- Construction activity slowed somewhat, constrained by rising costs in some Districts.
- Home sales were flat or little changed in most Districts, and nonresidential real estate activity was also mostly steady.
- Activity in the agriculture sector remained weak.
- Energy sector activity declined slightly, and transportation activity was mixed.
- Looking ahead, the outlook was neutral to slightly pessimistic, as only two Districts expected activity to increase, and others are looking for flat or slightly weaker activity.
Headline retail and food service sales rose 0.6% in June, following an unrevised 0.9% decline in May. Sales in June were higher in miscellaneous retailers, motor vehicle & parts dealers, building & garden centers, clothing & accessory stores, restaurants and bars, general merchandise stores, grocery stores, health & personal care stores, online platforms, and sporting goods & hobby stores. On the other hand, sales fell at furniture & home furnishing stores, electronics retailers, and department stores, while remaining unchanged at gas stations. Core retail sales (excluding vehicle & gas station sales) rose 0.6% after being flat in May.
Import prices (which do not include tariffs) inched up 0.1% in June after falling 0.4% in May. Prices for imported fuels fell 0.7% while prices of nonfuel imports rose 0.1%. After falling 0.6% in May, prices for exported goods increased 0.5% in June thanks to increases in both agricultural (0.8%) and non-agricultural (0.5%) export prices. Compared to a year ago, import prices were down 0.2% while export prices were 2.8% higher.
Headline housing starts increased 4.6% in June to a 1.32 million annual pace, bouncing back from the lowest level in five years registered in May. However, chemistry-intensive single-family starts fell 4.6% from May, with losses in all the country’s regions. Multifamily starts jumped 30.6% in June, more than offsetting the decline in single-family. Forward-looking building permits rose 0.2% after falling in the previous two months. Compared to a year ago, housing starts were down 0.5% Y/Y while building permits were off 4.4% Y/Y.
Homebuilder sentiment (as measured by the NAHB/Wells Fargo Housing Market Index) rose slightly in July, increasing one point to 33. Two of the three subcomponents – current sales activity and expected sales – witnessed gains, while buyer traffic declined.
The Fed’s Beige Book included several comments on chemicals and plastics:
- Eleventh District (Dallas): “There was slight growth in nondurable goods manufacturing excluding petrochemical manufacturing which experienced declines.”
- Sixth District (Atlanta): “While demand for petrochemical products was strong, a contact described chemical production as overbuilt, creating some softness in the sector.”
- Seventh District (Chicago): “Orders for chemicals and plastics declined a bit.”
- Second District (New York): “One regional plastic and rubber products manufacturer noted an increase in business from firms looking to reshore manufacturing for some goods.”
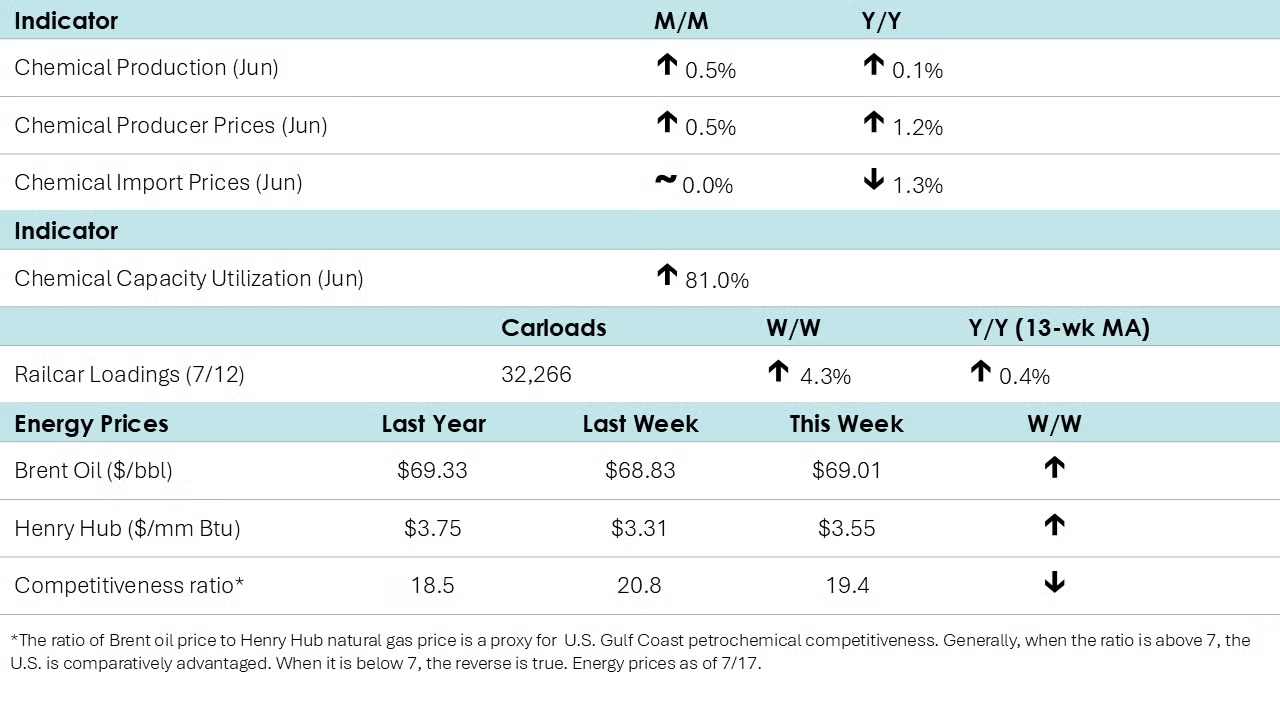
According to data released by the Association of American Railroads, chemical railcar loadings were up to 33,599 for the week ending July 12th. Loadings were up 0.4% Y/Y (13-week MA), up 1.8% YTD/YTD and have been on the rise for seven of the last 13 weeks.
Following two months of losses, chemical producer prices rose 0.3% in June. There were increases in the prices of most product categories, particularly manufactured fibers, agricultural chemicals, consumer products, inorganic chemicals, and other specialty chemicals. These gains were partially offset by lower prices for synthetic rubber and coatings. Prices for bulk petrochemicals and organics were flat. Compared to a year ago, chemical producer prices were up 1.2% Y/Y.
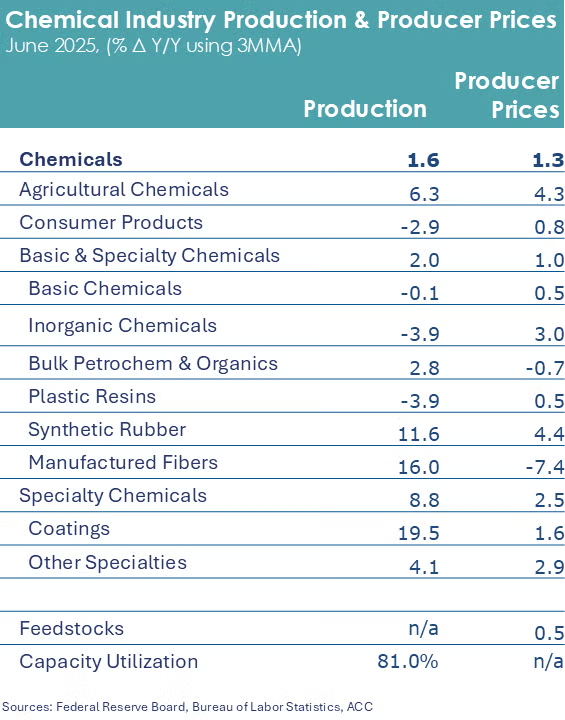
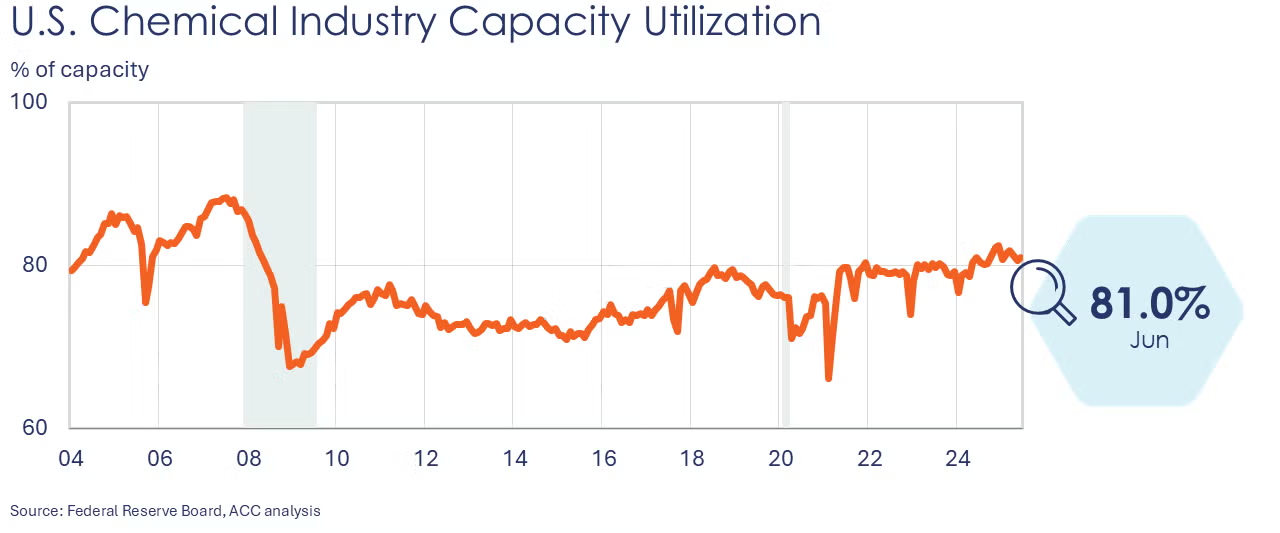
Following flat growth in April and May, chemical production expanded by 0.5% in June. There were gains in the output of plastic resins, synthetic rubber, manufactured fibers, inorganic chemicals, industrial gases, coatings and consumer products. Those gains were partially offset by declines in the output of other specialty chemicals, organic chemicals, crop protection and fertilizers. Chemical industry capacity utilization ticked higher by 0.1 percentage points to 81.0%.
Chemical import prices (which do not include tariffs) were unchanged in June but remained lower compared to a year earlier for a 31st straight month.
Energy Wrap-Up
- Oil prices were down following the announcement of a longer-than-expected 50-day deadline for Russia to end the Ukraine war.
- A looming heatwave pushed U.S. natural gas prices higher.
- Higher demand for natural gas for air conditioning limited last week’s inventory build to 46 BCF.
- The combined oil & gas rig count eased by one to 532 at the end of last week, the 11th consecutive decline.
For More Information
ACC members can access additional data, economic analyses, presentations, outlooks, and weekly economic updates through ACCexchange.
In addition to this weekly report, ACC offers numerous other economic data that cover worldwide production, trade, shipments, inventories, price indices, energy, employment, investment, R&D, EH&S, financial performance measures, macroeconomic data, plus much more. To order, visit the ACC Store.
Every effort has been made in the preparation of this weekly report to provide the best available information and analysis. However, neither the American Chemistry Council, nor any of its employees, agents or other assigns makes any warranty, expressed or implied, or assumes any liability or responsibility for any use, or the results of such use, of any information or data disclosed in this material.

